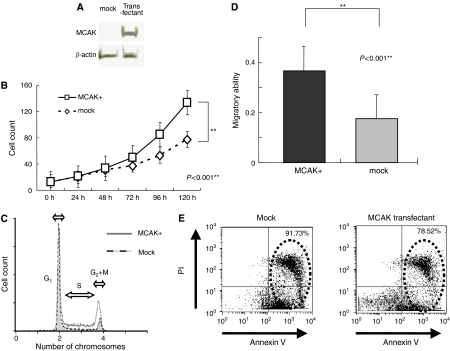
Figure 3.
Experimental studies. (A) Western blotting revealed that MCAK protein was detected in transfectants but not in mock-transfected cells. β-Actin was used as a control. Right and left lanes show transfected and mock-transfected cells (cell line AZ521), respectively. (B) Growth rate of MCAK transfectants and mock-transfected cells in 10% FBS. Bar=s.d.; cell counts were greater in MCAK transfectants than in mock-transfected cells (P<0.001). (C) Cell cycle analysis of MCAK transfectants and mock-transfected cells after 24 h of serum starvation followed by 18 h serum feeding with 10% FBS. The G1-phase cell counts were unified. The S-phase fraction was greater in transfectants (44.3%) than mock-transfected cells (25.3%). (D) Migration assay. The migratory ability of transfectants was significantly stronger than that of mock-transfected cells (P<0.001). (E) Anoikis analysis. After anoikis induction for 18 h, the apoptosis rate was measured by annexin V and PI staining. Proportion of apoptotic MCAK-transfected cells (78.52%) was less than that of apoptotic mock-transfected cells (91.73%).

