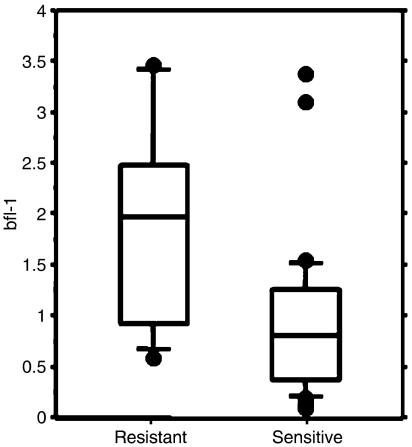
Figure 2.
Correlation between bfl-1 expression and in vitro fludarabine-induced apoptosis. Isolated B cells (0.5 × 10⁶) from B-CLL patients (all 37 patients included in the study, Table 1) were cultured in 96-well plates in medium alone (non-supplemented with FBS) or with fludarabine (5 μM). Apoptosis was measured after 48 h of culture using AnnexinV staining and fludarabine-specific apoptosis was calculated as described in Materials and Methods section. Cells were considered resistant if specific fludarabine-induced apoptosis was less than 25% (resistant, n=11; sensitive, n=26). bfl-1 mRNA expression was determined before culture using competitive PCR. Results are shown as mRNA expression relative to the median of the sample population. Boxes show intraquartile range. Whiskers correspond to the 10th and 90th percentile, and horizontal line within boxes represents the median value. Comparison: resistant vs sensitive, P<0.01.

