Figure 5.
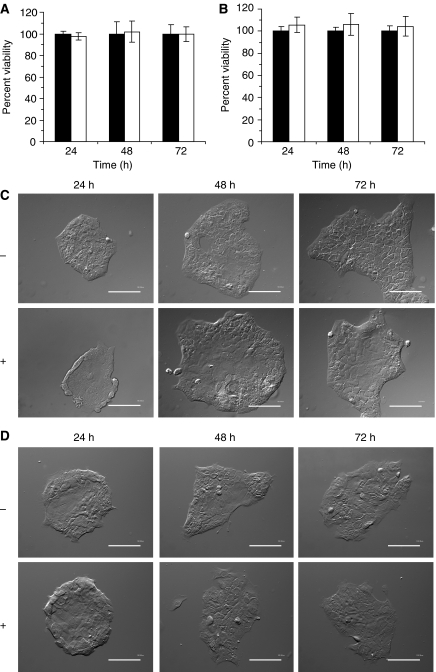
Cell proliferation and morphology post-removal of benzyl-α-GalNAc. (A) Capan-1 and (B) HPAF-II cells (1 × 10⁴ cells per ml) were exposed to 0.4 and 0.8 mg ml−1 of benzyl-α-GalNAc, respectively. Following 48 h exposure to benzyl-α-GalNAc the cells were washed with 1 × PBS and allowed to grow for next 24, 48 and 72 h in fresh media. The percent viability of cells was measured at each time point following exposure to benzyl-α-GalNAc (open bars, □) and compared with percent viability of cells not exposed to benzyl-α-GalNAc (closed bars, ▪). (C–D) Viability of Capan-1 and HPAF-II cells at 100% 24, 48 and 72 h post-removal of benzyl-α-GalNAc, and DIC microscopy of (C) Capan-1 and (D) HPAF-II cells post-removal of inhibitor (× 20 magnification).

