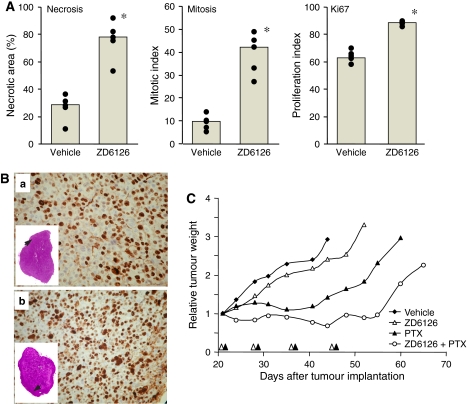
Figure 3.
Antitumour effect of paclitaxel (PTX) given after ZD6126. (A) Mice bearing MDA-MB-435 tumour xenografts were treated with ZD6126 (200 mg kg−1 i.p.) or vehicle as described in the legend to Figure 2. Tumours (n=5) were removed 24 h later, processed and analysed as described in Materials and Methods section. Necrosis, mitotic index, and proliferation index were evaluated. Symbols indicate values for each tumour (mean of values from five HPFs/tumours), columns are the median. *P=0.004 compared to vehicle (Mann–Whitney U-test). (B) Representative images of Ki-67 stained sections of tumours treated with vehicle (a) or ZD6126 (b). Insets show the whole sagittal area of the tumour (original magnification × 10), arrows indicate the viable area where mitosis and proliferation were analysed. (C) Mice bearing MDA-MB-435 tumours (approximately 450 mg) were treated with PTX (20 mg kg−1 i.v.) 24 h after ZD6126 (200 mg kg−1 i.p.). Mice received weekly cycles of treatments for four courses. n=6–10. Black (PTX) and white (ZD6126) arrowheads indicate treatments. See for comparison the opposite schedule (namely, PTX given 24 h before ZD6126) in Figure 2B.

