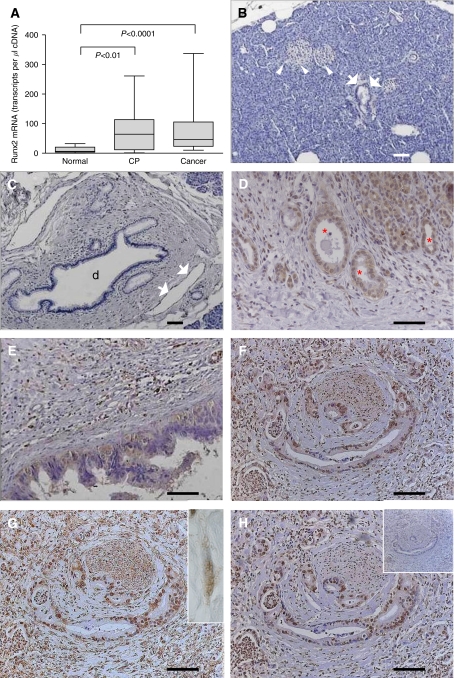
Figure 1.
(A) Runt-related transcription factor-2 mRNA expression levels in pancreatic tissues: QRT–PCR analysis of mRNA levels for Runx2 in normal, CP, and PDAC tissue samples was carried out as described in the Patients and Methods section (box and whiskers graph). RNA input was normalised to the average expression of the two housekeeping genes HPRT and cyclophilin B, and is presented as transcripts/μl cDNA. (B–H) Runx2 localisation in human pancreatic tissues: Runx2 immunohistochemistry was performed as described in the Patients and Methods section. Normal pancreatic tissues showing absent Runx2 staining in the islets (B, white arrowheads), acini, and small ducts (B, white arrows) as well as large ducts (C, d) and endothelial cells (C, white arrows). (D) Chronic pancreatitis tissues displaying moderate staining in tubular complexes (red asterisks) and degenerating acini. (E–H) Pancreatic cancer tissues showing moderate Runx2 staining in the cytoplasm of PanIN lesions (E), in the cytoplasm and nuclei of cancer cells using three different Runx2 antibodies (F–H), and fibroblasts (G, inset, white arrows). Note the absent staining in a consecutive tissue section incubated with the corresponding normal IgG as a negative control (H, inset). Horizontal lines represent the scale bar of 50 μm.

