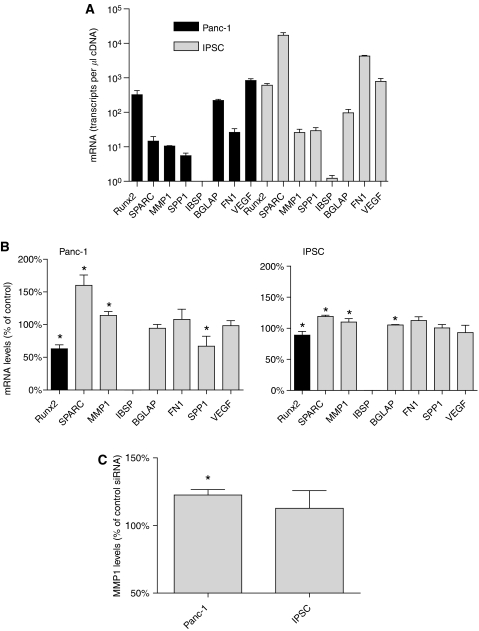
Figure 3.
(A) mRNA levels of Runx2 and Runx2 target genes in Panc-1 and IPSCs were determined by QRT–PCR as described in the Patients and Methods section and presented as mean±s.e.m. (n=3). (B) The effects of Runx2 silencing on the mRNA expression of target genes were determined in Panc-1 cells and IPSCs by QRT–PCR analysis and presented as mean±s.e.m. (n=3), compared to control transfected cells. (C) The effects of Runx2 silencing on MMP1 protein levels were determined by an ELISA assay as described in the Patients and Methods section, and presented as mean±s.e.m. (n=3) compared to control transfected cells (*P<0.05).

