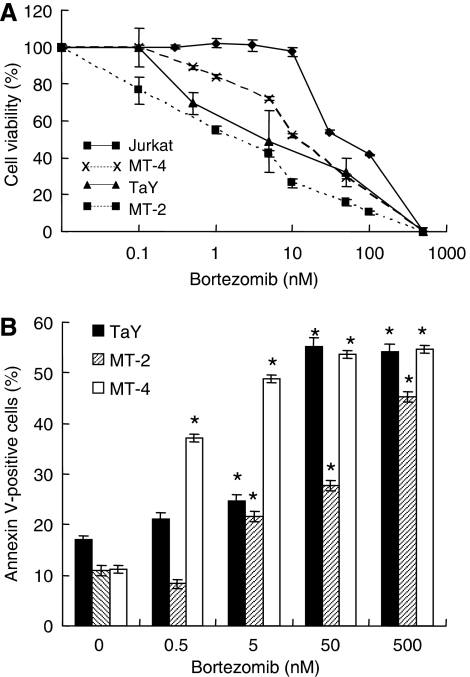
Figure 1.
(A) Cytotoxity of bortezomib on TaY, MT-2, MT-4 and Jurkat. Cells were cultured in the presence or absence of increasing doses of bortezomib (1–500 nM). The percentage of viability is plotted with respect to untreated cells. The results are shown as means (±s.d.) percentage of viability from triplicate cultures with repeated experiments. (B) Bortezomib induced apoptosis in ATL cell lines (TaY, MT-2 and MT-4). Cells were cultured in the presence of bortezomib for 24 h. Cell death was analysed by an annexin V-biotin apoptosis detection kit. Apoptosis is expressed as a percent of Annexin V-positive cells in bortezomib-treated cells.

