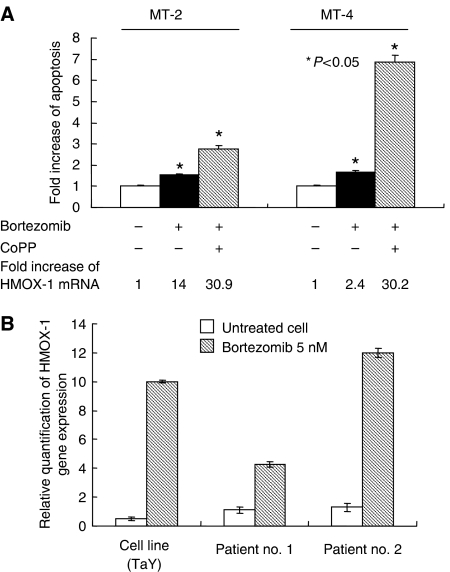
Figure 5.
(A) Induction of HMOX-1 by CoPP enhances apoptotic effects of bortezomib in MT-2 and MT-4 cells. Fold increase of HMOX-1 mRNA is shown at the bottom of the graph. (B) Comparison of gene expression levels between cell line (TaY) and patient sample. Percent of ATL cells in the blood specimens is 46% in patient no.1 and 82% in patient no. 2, respectively. Relative gene expression levels are expressed as ratios (copy numbers of target gene/copy numbers of GAPDH). In the presence of bortezomib, upregulation of HMOX-1 is evident in both TaY cells and patient samples.

