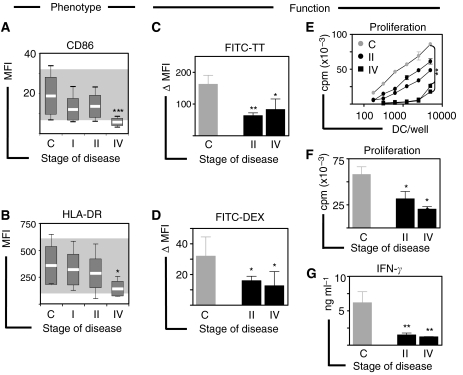
Figure 3.
Blood DC exhibit reduced immunostimulatory phenotype. (A) In a cohort of 40 patients with breast cancer (stage I, n=19; stage II, n=12 and stage IV, n=9), the level of expression of (A) CD86 and (B) HLA-DR was analysed according to the stage of disease and compared with controls (n=14). Shaded areas indicate normal reference ranges and box plots show means, standard deviations and ranges. (C and D) Antigen uptake of soluble (FITC-TT) and particulate (FITC-Dextran) antigens by blood DC from patients with early (stage II, n=7) and advanced (stage IV, n=4) disease compared to controls (n=7) is presented as the difference in mean fluorescence intensity. (E) Allo-stimulatory capacity of blood DC as tested by mixed leucocyte reaction (MLR). One representative experiment in which increasing numbers of blood DC purified from patients with early (stage II, n=2) or advanced (n=2) disease and a healthy control (n=1) were tested against allogeneic T cells purified from a panel (n=3) of healthy volunteers. The pairs giving maximal responses are shown as means of triplicate measurements. (F) Summary of proliferation data from MLRs using DC from patients with early (stage II, n=6) and advanced (stage IV, n=3) disease compared to controls (n=13) at a 1 : 30 DC:T ratio. Similar results were found for all DC:T ratios. (G) Summary of IFN-γ secretion in culture supernatants collected from MLRs at a 1 : 30 DC:T ratio as assessed by ELISA. Error bars correspond to s.e.m. Significant differences compared to controls are shown as *P<0.05, **P<0.01 and ***P<0.001. All samples were analysed prior to therapy.

