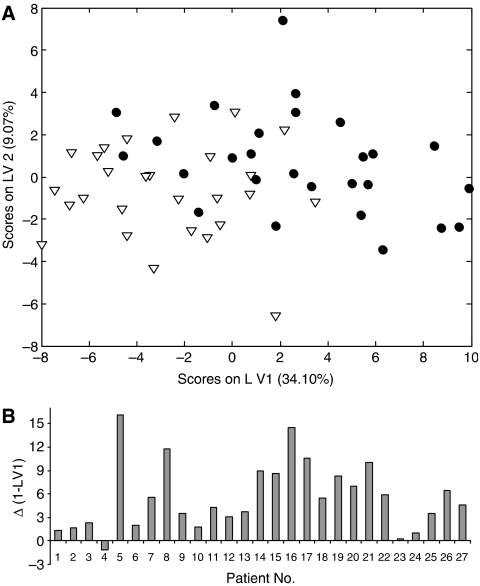
Figure 1.
Partial least squares discriminate analysis (PLSDA) of serum proteomic features before/during HCC. (A) Plots the data using two latent variables (LV1 and LV2). Filled circles represent pre-HCC samples and hollow triangles during-HCC samples. (B) Shows the change in LV1 associated with the development of HCC in each patient. PLSDA was performed using PLS_Toolbox (Version 3.5, Eigenvector Research, Manson, WA, USA) running in Matlab (Version 7.1, The MathWorks, Natick, MA, USA).

