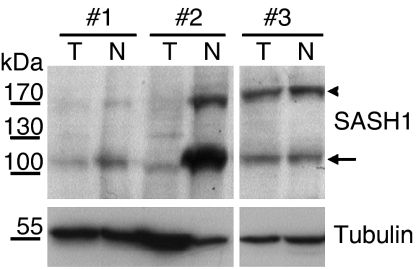
Figure 3.
SASH1 protein expression in tumour (marked ‘T’) and matched normal tissue (marked ‘N’) from three representative patients. The SASH1 signal has an apparent molecular weight of 180 kDa (arrowhead). SASH1 expression was lower in tumour than in corresponding normal tissue in eight out of 10 tested patients, as seen in patients #1 and #2. In case #3, SASH1 expression was unchanged in the tumour as compared to normal colon. Note the presence of a prominent additional band with higher electrophoretic mobility, which is also reduced in tumours (arrow). Tubulin staining as loading control indicated in the lower panel.

