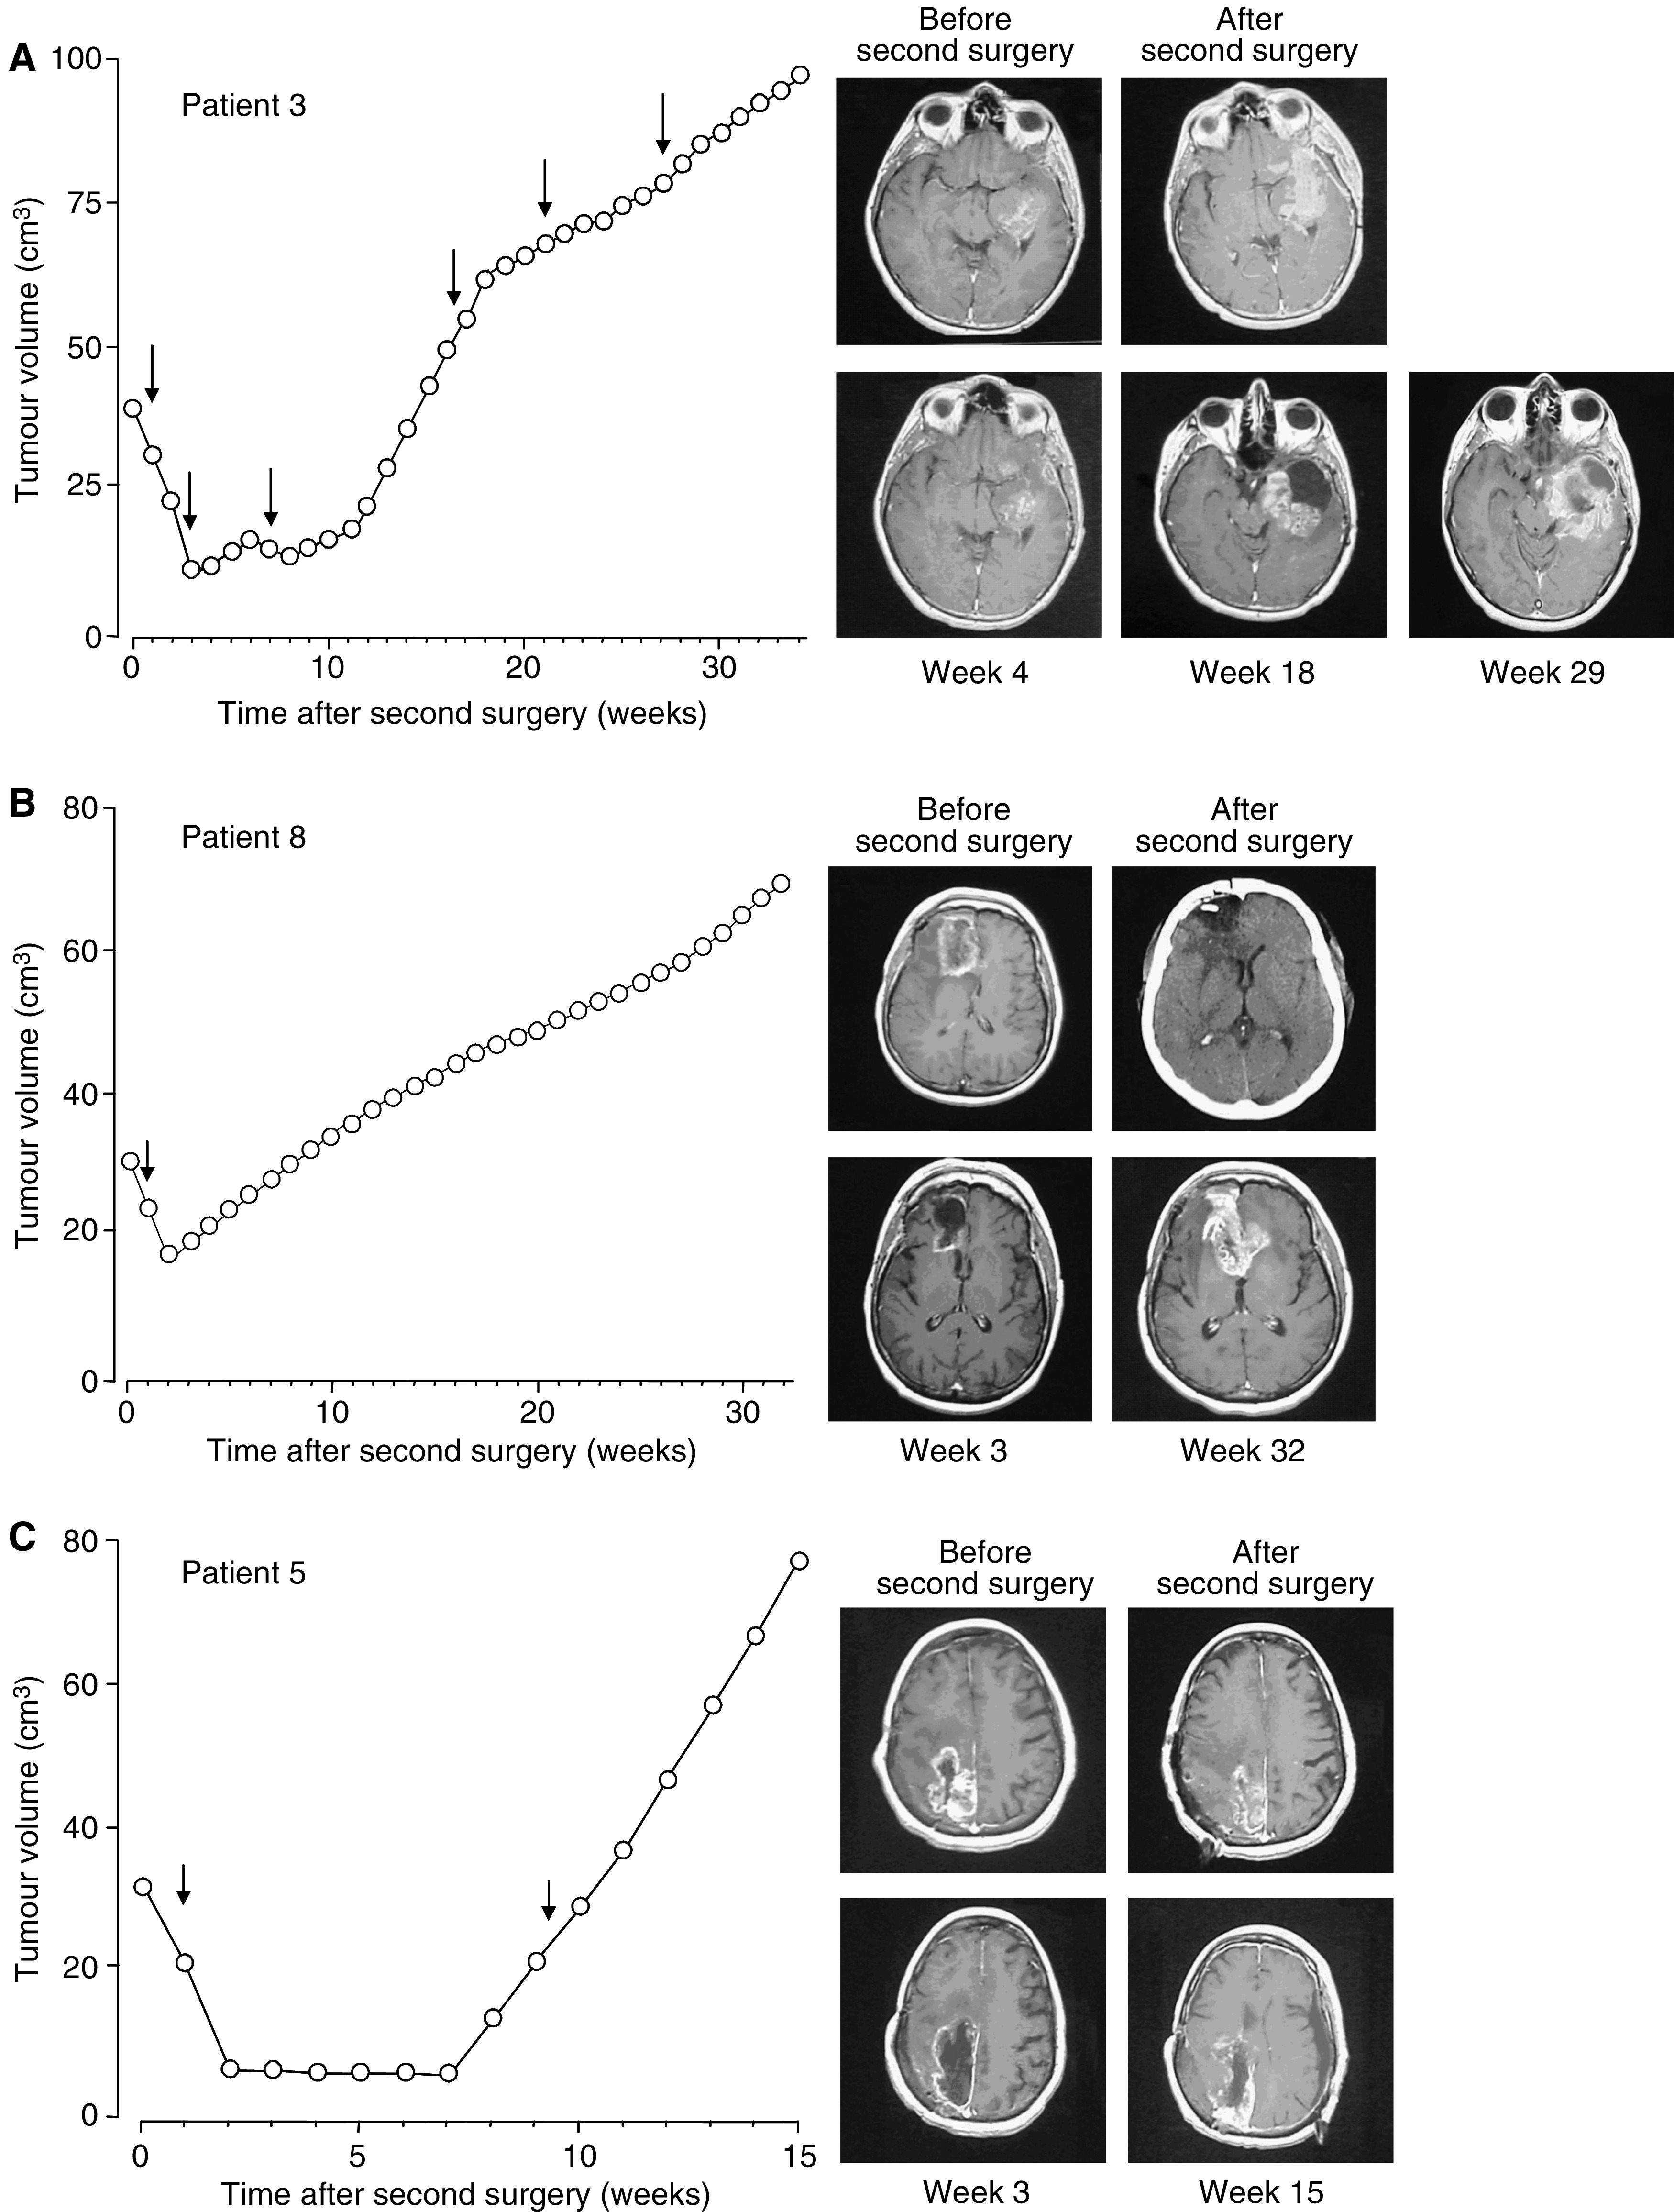
Figure 2.

Effect of THC administration on tumour growth. Tumour growth plots and gadolinium-enhanced T1-weighted magnetic resonance scans after the second surgery in three patients. Arrows indicate the THC administration cycles. (A) Patient 3, scans before and after surgery of tumour relapse as well as after the second, fourth and sixth THC cycle (weeks 4, 18 and 29, respectively). (B) Patient 8, scans before and after surgery of tumour relapse as well as after the THC cycle (week 3) and at week 32. (C) Patient 5, scans before and after surgery of tumour relapse as well as after the fist THC cycle (week 3) and at week 15.
