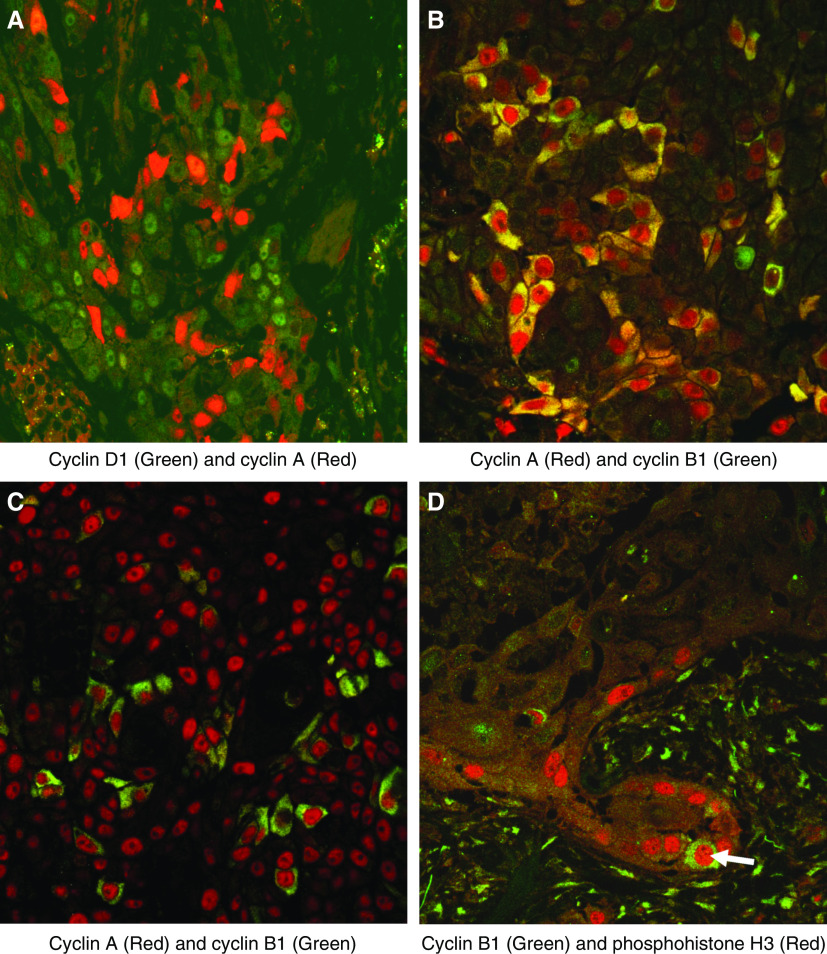
Figure 3.
Double labelling fluorescent confocal microscopy analysis of coexpression of putative phase-specific markers. (A) There was negligible coexpression of cyclin D1 and cyclin A. (B) In dysplasia there was focal coexpression of cytoplasmic cyclin B1 (green) and cyclin A (red), the latter showing a nuclear and cytoplasmic distribution. An area of maximal coexpression is illustrated here. (C) In SCC, cytoplasmic cyclin B1 (green) was coexpressed by relatively few cyclin A positive cells (red). (D) Rare cells in SCC (arrow) showed nuclear expression of phosphohistone H3 (red) plus cytoplasmic staining for cyclin B1 (green), in keeping with cells at the G2/M transition.

