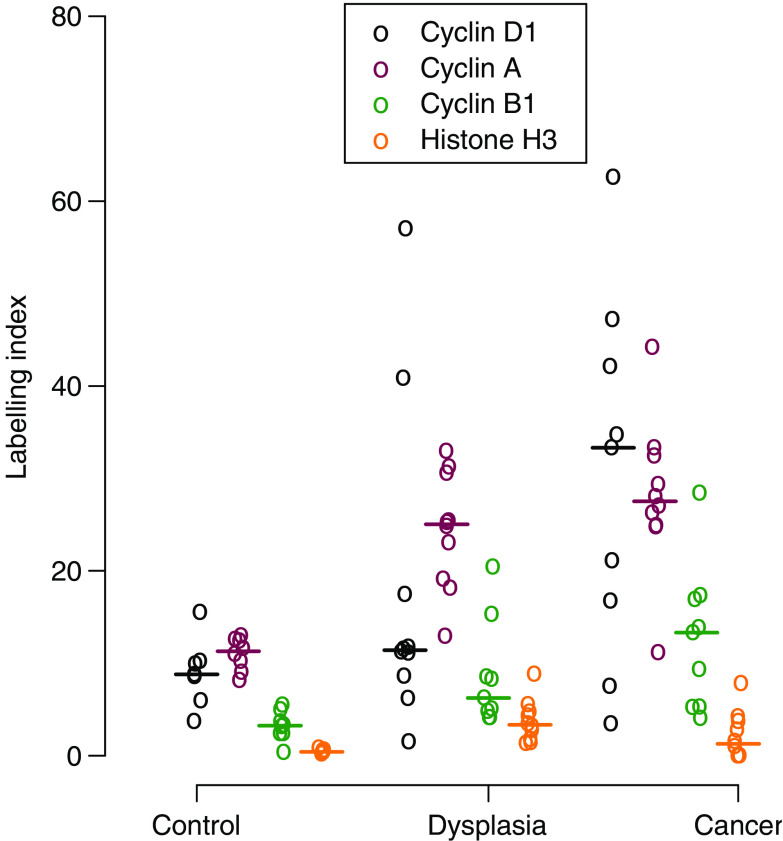
Figure 4.
Labelling indices for putative cell cycle phase markers. Dot plot of cell cycle phase marker LIs in normal larynx (control), laryngeal dysplasia (dysplasia), and laryngeal squamous cell carcinoma (cancer). The LIs increased on progression from normal larynx through dysplasia to squamous cell carcinoma for cyclin D1 (P=0.015; J–T test), cyclin A (P=0.0001; J–T test), and cyclin B1 (P=0.0004; J–T test). There was no evidence of an increase in the LI for phosphohistone H3 (P=0.29; J–T test). Circles=individual values. Bar=median value.

