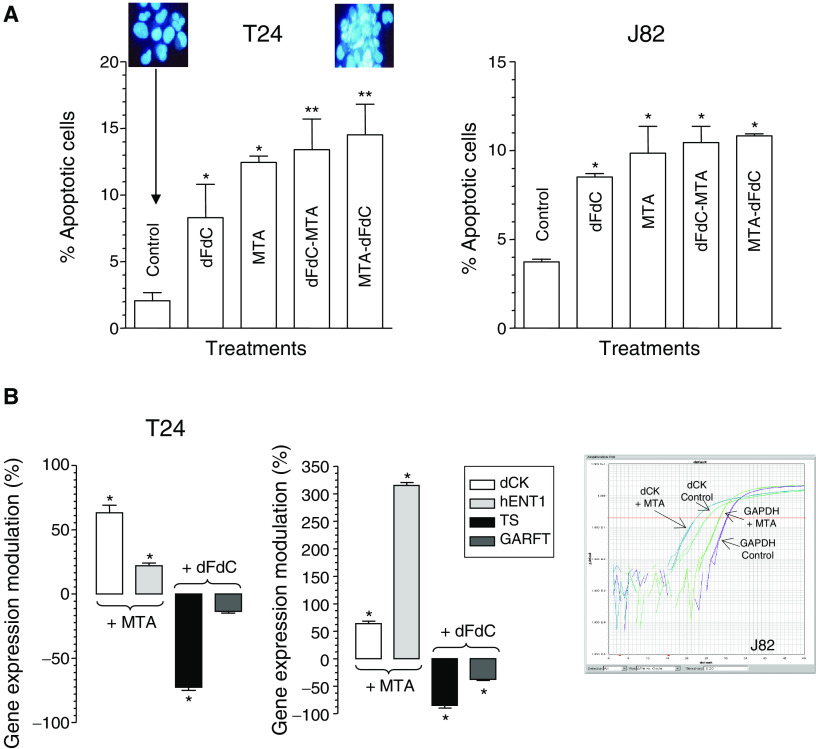
Figure 3.
Percentage of cells with damaged DNA after drug treatments with gemcitabine (dFdC), pemetrexed (MTA) and their combinations in both cell lines (A). Upper panels, morphological appearance of control and treated cells. Modulation of hENT1 and dCK expression by pemetrexed and modulation of TS and GARFT expression by gemcitabine in comparison with control in T24 and J82 cells (B). Right panel, representative plot of dCK and GAPDH expression in control and treated J82 bladder cancer cells. Columns, mean values obtained from three independent experiments; bars, s.d. *P<0.05 with respect to control, **P<0.05 with respect to gemcitabine.

