Figure 1.
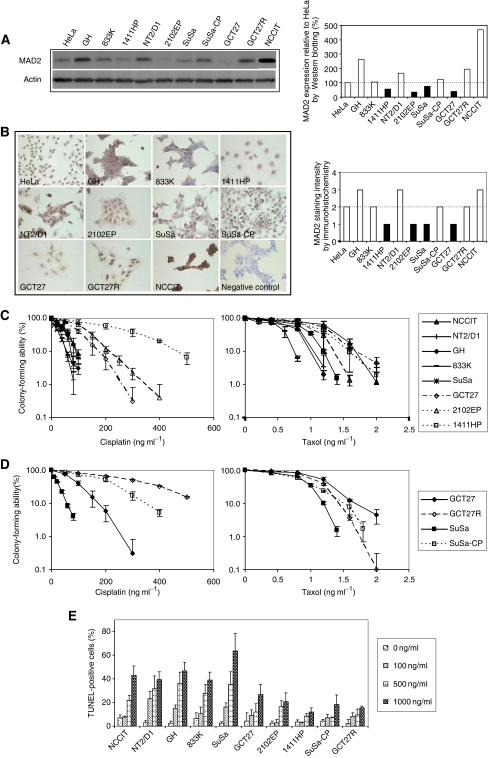
Correlation of MAD2 expression and sensitivity to cisplatin and taxol. (A) MAD2 expression in 10 TGCT cell lines GH, 833K, 1411HP, NT2/D1, 2102EP, SuSa, SuSa-CP, GCT27, GCT27R and NCCIT analysed by Western blotting. A human cervical carcinoma cell line HeLa was used as a positive control. (B) Representative results of immunohistochemical staining of MAD2 in HeLa, GH, 833K, 1411HP, NT2/D1, 2102EP, SuSa, SuSa-CP, GCT27, GCT27R, NCCIT cells and a negative control with primary antibody omitted. Photographs were taken under × 400 magnifications. (C) Colony-forming ability of TGCT cell lines with high (solid lines) and low (dotted lines) levels of MAD2 protein after exposure to cisplatin (left panel) and taxol (right panel). Note that cells with high levels of MAD2 (solid lines) were more sensitive to cisplatin but not to taxol. Results represented means of three independent experiments and error bars indicated standard deviation. (D) Colony-forming assay of acquired cisplatin-resistant cell lines and their parental lines. Results represented means of three independent experiments and error bars indicated standard deviation. (E) Terminal deoxynucleotidyl transferase-mediated nick end labelling staining of the 10 TGCT cell lines after treatment with three doses of cisplatin for 4 days. Note that the percentage of TUNEL-positive cells was higher in cell lines with high level of MAD2 (NCCIT, NT2/D1, GH, 833K and SuSa) than cell lines with low levels of MAD2 (GCT27, 2102EP and 1411HP). Results represented means of three independent experiments and error bars indicated standard deviation.

