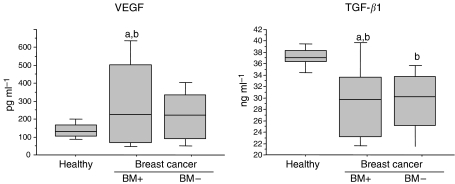
Figure 1.
Box plots of serum VEGF and TGFβ1 levels in patients with breast cancer with (BM+, n=28) or without (BM−, n=34) bone metastasis and healthy controls (n=15). From the bottom-up, the box indicates the 25th, 50th (median) and 75th percentiles, while the bars indicate the 10th and 90th percentiles, respectively. Significance levels were obtained from non parametric Mann–Whitney test: (a) P<0.05: vs BM- , (b) P<0.05: vs healthy controls.

