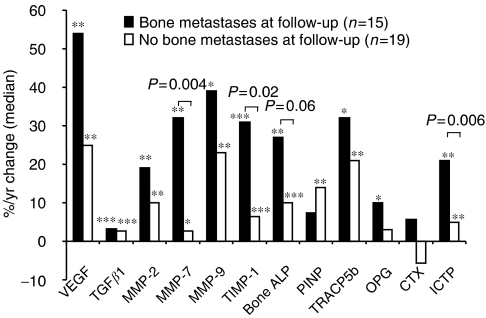
Figure 5.
Changes of biochemical marker levels in patients with primary breast carcinoma who developed or remained free of bone metastases during a 3 years follow-up. The bars represent the changes of levels between the follow-up and the initial visits divided by the duration of follow-up and expressed as percentage of the initial value. The actual P-values indicated on the figure refers to the comparison of the percentage changes between the two groups. *P<0.05, **P<0.01, ***P<0.001 at follow-up vs baseline in each group separately.

