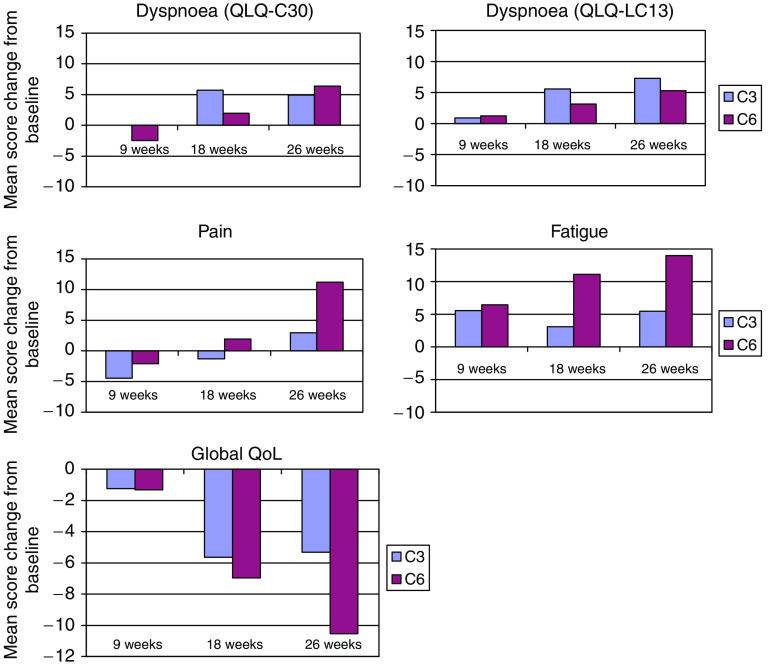
Figure 1.
Mean score changes from baseline to key follow-up time points for primary outcome symptoms and global QoL, calculated from individual patients measured at baseline and 9 weeks (C3, N=105; C6, N=103), 18 weeks (C3, N=77; C6, N=87) and 26 weeks (C3, N=62; C6, N=73), respectively. For symptom measures score, changes >0 indicate increased symptoms (i.e. deterioration), while for the global QoL score, changes >0 indicate improvement. No significant group differences were seen.

