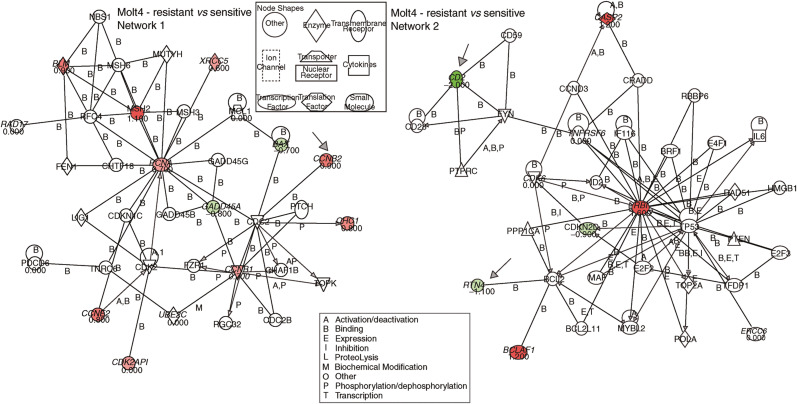
Figure 5.
Pathway analysis of genes that were differentially expressed in resistant compared to sensitive Molt-4 ALL cells. Arrows indicate genes discussed in the text. Forty-three probe sets (28 unique genes) were differentially expressed between resistant and sensitive Molt-4 ALL cells or changed expression before and after treatment with MP in resistant compared to sensitive Molt-4 ALL cells. These genes served as the input for the pathway query. Two networks were found that included the input genes, labelled in green if expression is lower in resistant compared to sensitive Molt-4 ALL cells and red if expression is higher, respectively. The number below the gene indicates the fold-change.

