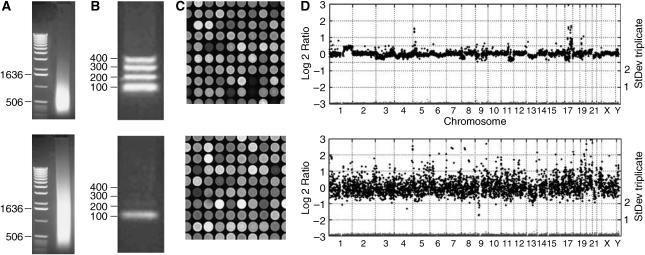
Figure 2.
aCGH success is determined by the ability to PCR-amplify fragments of > 100 bp from the sample (FFPE) DNA template. (A) 0.8% agarose gel electrophoresis shows amount, size and smear-lengths of sample DNA isolated from FFPE tumour tissues. (B) Multiplex-PCR reveals whether a 100, 200, 300 or 400 bp fragment are amplified from 100 ng total genomic DNA. (C) Representative partial images of array CGH hybridisations. Array CGH was performed on 3500, DOP-amplified BAC-DNA microarrays (see Materials and Methods) printed on Codelink® slides. (D) Gain and loss profiles were plotted where the ordinate represents the log 2 ratio for the mean of triplicates for each BAC, and abscissa the mapping on the genome (from chromosome 1 to Y, left to right). In red, the standard deviation of the triplicate measurements is plotted to a secondary Y-axis on the right.

