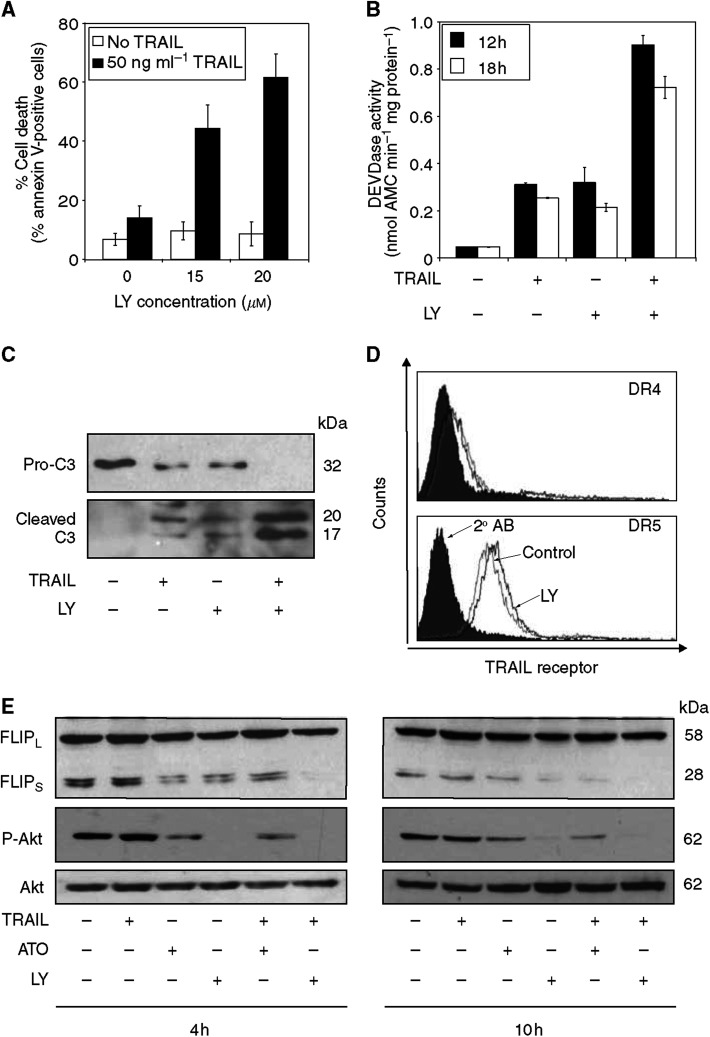
Figure 6.
Inhibition of Akt signalling mimics the effect of ATO in Jurkat cells. Cells were treated with the PI3K inhibitor LY294002 (20 μM) 1 h prior to treatment with TRAIL for 12 h. Cell death was assessed by FACS analysis of annexin V-stained cells. The graph shows the average values of three independent experiments ±s.d. (B) DEVDase activity in cells treated with TRAIL, ATO or both for the indicated times. DEVDase activity was measured in whole-cell lysates with a kinetic assay. Enzyme activity was expressed as nmole AMC released per minute by 1 mg total cellular protein. The chart represents the result of three independent experiments ±s.d. (C) Western blot analysis of pro-caspase-3 cleavage in lysates of Jurkat cells treated with TRAIL (50 ng ml−1), ATO (500 ng ml−1) and TRAIL+ATO for 10 h. The figure shows one representative picture from three independent experiments. (D) FACS analysis of DR4 and DR5 cell surface expression after 5 h treatment with LY294002 (20 μM). The histograms are representatives of at least three independent experiments. (E) Western blot analysis of phosphorylated Akt, Akt and c-FLIP following treatment with 20 μM LY294002 or 500 ng ml−1 ATO in the presence or absence of 50 ng ml−1 TRAIL for the times indicated. The figure is one representative of three independent experiments.

