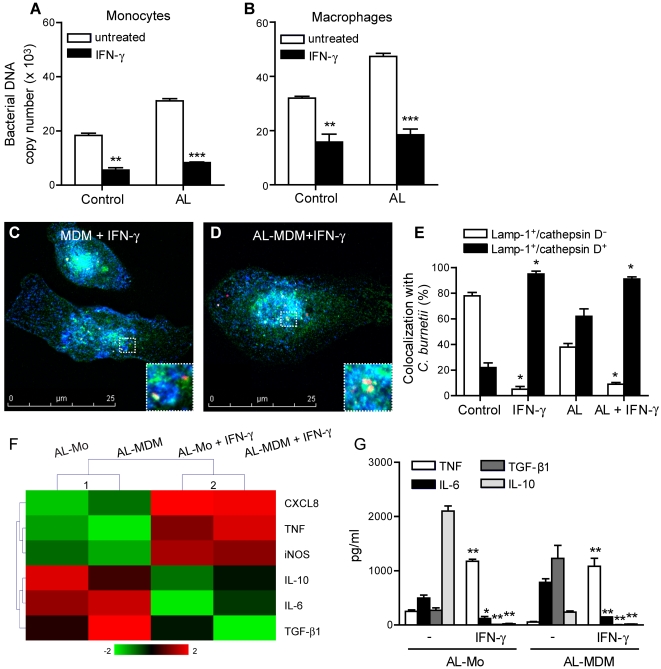
Figure 6. Effect of IFN-γ on AL-Mo and AL-MDM responses.
Mo and MDM that had or not ingested AL were infected with C. burnetii for 4 h in the presence of 1000 U/ml of IFN-γ. A and B, After washing, Mo and AL-Mo (A) or MDM and AL-MDM (B) were cultured for 9 days in the presence of IFN-γ. C. burnetii replication was determined by qPCR. The results represent the mean±SEM of 3 experiments. C–E, After washing, MDM and AL-MDM were cultured for 24 h in the presence of IFN-γ. Cells were labeled with anti-C. burnetii (Alexa 546), anti-Lamp-1 (Alexa 488) and anti-cathepsin D (Alexa 647) Abs and analyzed under a confocal microscope. Representative micrographs of IFN-γ-treated MDM (C) and AL-MDM (D) are shown with expanded images (white rectangle). In E, the results are expressed as the percentages of C. burnetii phagosomes that colocalised with Lamp-1 and/or cathepsin D. F, The transcriptional response of AL-Mo and AL-MDM stimulated with C. burnetii for 4 h in the presence or the absence of IFN-γ was analyzed by qRT-PCR. The results are expressed as the Log2 fold change and analyzed by hierarchical clustering. G, AL-Mo and AL-MDM were stimulated with heat-killed C. burnetii for 24 h in the presence or the absence of IFN-γ. The cytokine release was determined by immunoassays and expressed in pg/ml. The results represent the mean±SEM of 3 experiments. * p<0.05, ** p<0.01 and *** p<0.001.

