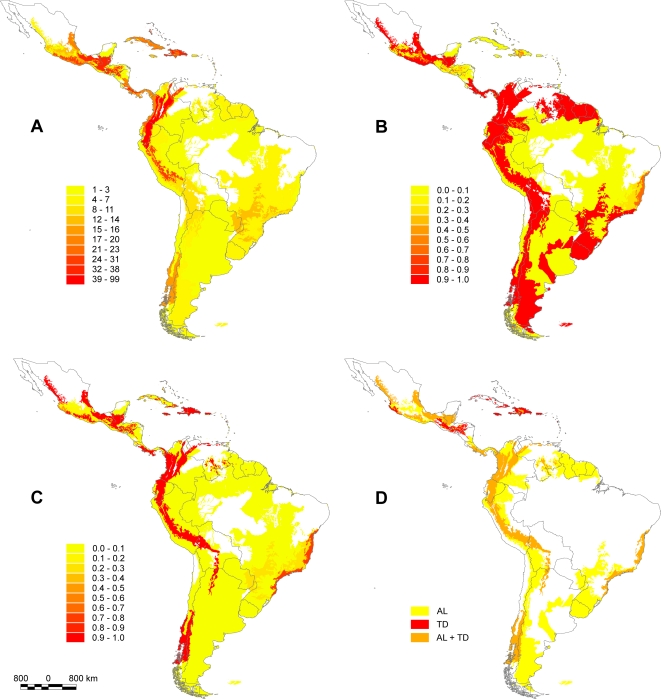
Figure 1. Pattern of species richness, irreplaceability and minimum ecoregion sets for representing threatened Neotropical anurans.
Spatial patterns of threatened anuran species richness across Neotropical ecoregions (A) and spatial patterns of irreplaceability estimated by the frequency of ecoregions in the 100 optimal solutions obtained with all threatened anuran species with aquatic larvae (B) and terrestrial development (C) found in the Neotropics. Map showing minimum ecoregion sets (n = 66 ecoregions) required for representation of all threatened anuran species with different developmental modes (D), both those with aquatic larvae (AL = yellow, n = 26 ecoregions) and those with terrestrial development (TD = red, n = 10 ecoregions). Ecoregions of high importance for species of both developmental modes (AL+TD, n = 50 ecoregions) are represented in orange.

