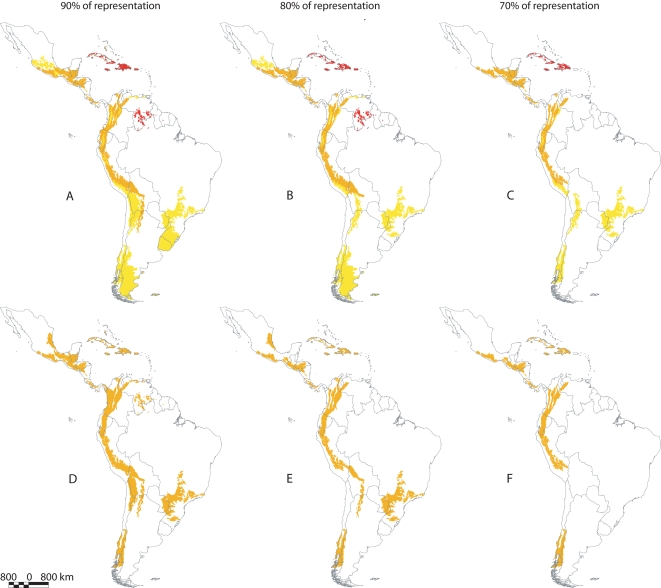
Figure 2. Key ecoregion sets for threatened Neotropical anurans obtained with or without discriminating species according to their developmental modes.
(A–C) Maps showing the minimum ecoregion sets required for representation of species with different developmental modes, both those with aquatic larvae (AL = yellow) and those with terrestrial development (TD = red)-at different cutoff levels of species representation (95, 80, and 70%). Ecoregions of high priority for species of both developmental modes (AL+TD) are represented in orange. (E–G) Maps show minimum ecoregion sets required for representation of anuran species at different cutoff levels of species representation (95, 80, and 70%).

