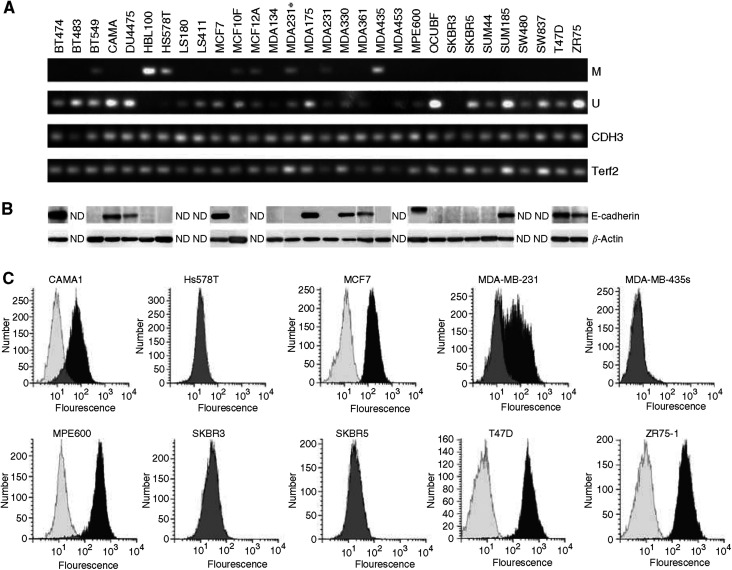
Figure 1.
Verification of CDH1 status in mammary cell lines. (A) Methylation-specific PCR. M=MSP specific for methylated CDH1 promoter, U=MSP specific for unmethylated CDH1 promoter, CDH3 and Terf2=control PCR fragments for integrity and modification of template DNA. (B) Western blot analysis for E-cadherin protein expression; β-actin is a loading control. (C) Fluorescence-activated cell sorting analysis for E-cadherin protein expression: overlay of control (white), without antibody and test (black), grey indicates overlap between control and test. The y-axis shows the number of cells and the x-axis the fluorescence of cells.

