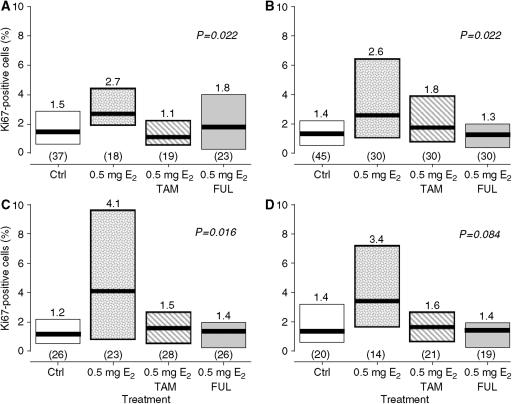
Figure 4.
The proliferative activity of normal breast epithelium taken from women at population risk of breast cancer (A), those at high risk (B), those carrying BRCA1 and BRCA2 mutations (C) and BRCA1 mutation carriers only (D) after implantation into athymic nude mice and treatment with 0.5 mg E2 for 1 week followed by 2 weeks of E2 combined with either TAM or fulvestrant. The thick horizontal lines indicate the medians as do the numbers on top of the columns indicating the IQRs. The numbers in parentheses are the numbers of samples available for analysis in each treatment group and the P-values indicate the significance of the differences across the treatment groups by the Kruskal–Wallis nonparametric analysis of variance. Ctrl=control; 0.5 mg E2=treatment with 0.5 mg E2-silastic pellets; TAM=tamoxifen (1 mg mouse−1 day−1); FUL=fulvestrant (5 mg mouse−1 week−1).

