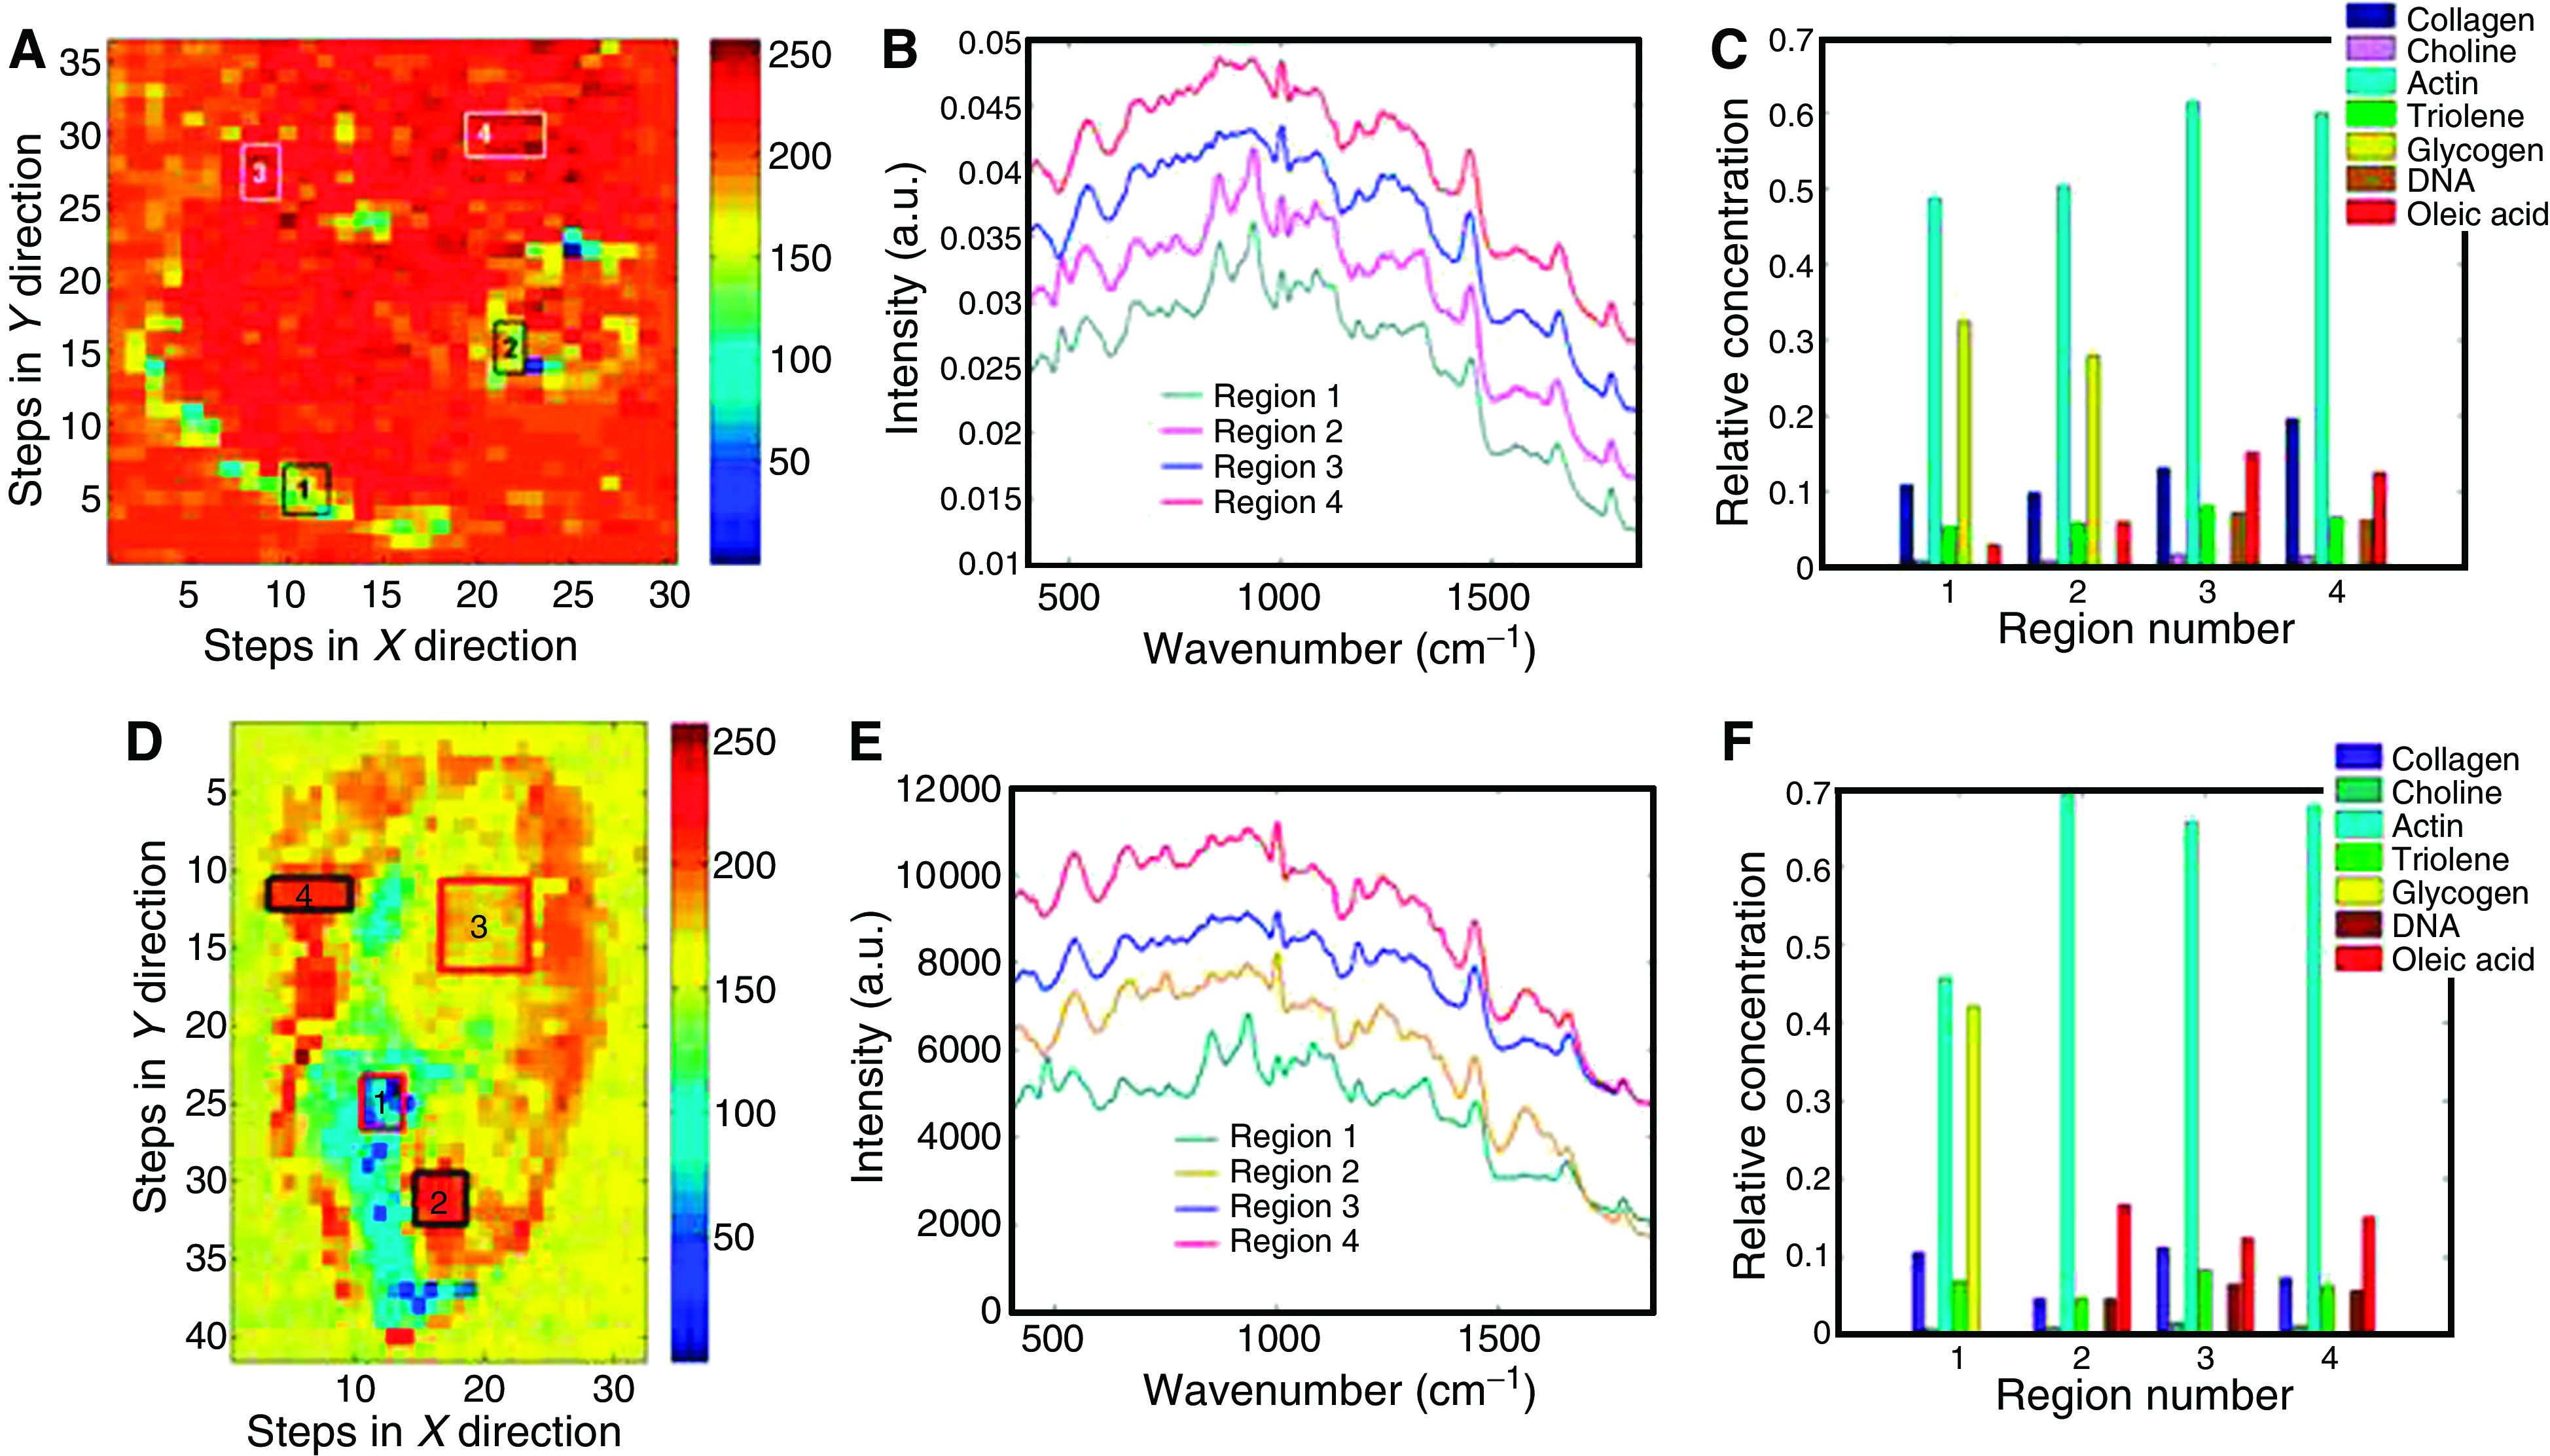
Figure 3.

Normal squamous and HGD sample (H&E stained section Figure 1A). (A) Third principal component score map with selected regions marked. (B) Mean Raman spectra from selected regions. (C) Relative concentration of selected biochemical constituents calculated with mean spectra from selected regions. Normal squamous and adenocarcinoma sample (H&E stained section Figure 1B). (D) Third principal component score map with selected regions marked. (E) Mean Raman spectra from selected regions. (F) Relative concentration of selected biochemical constituents calculated with mean spectra from selected regions.
