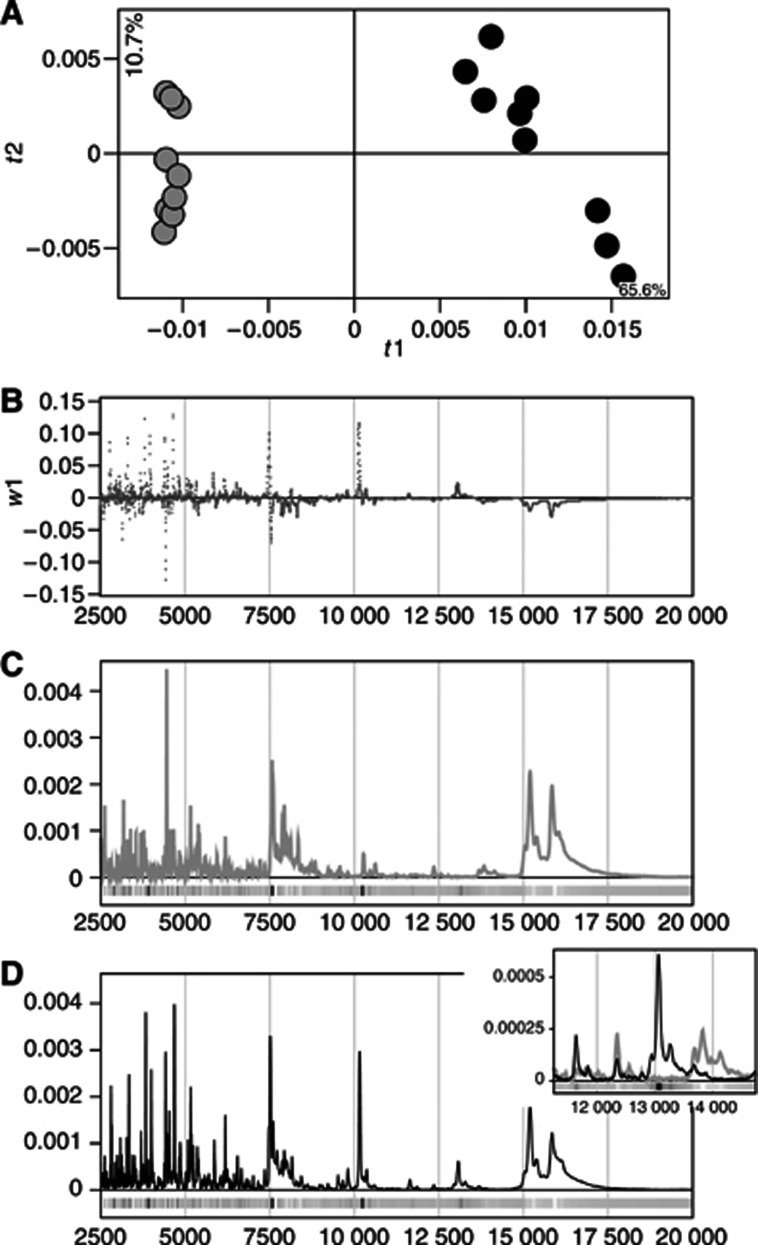
Figure 2.
Partial least squares model based on low mass range (2.5–20 kDa) data from the supernatant fraction of three normal tissue (grey) and three tumour tissue samples (black). All samples are from the untreated control group, killed 24 days after implantation and analysed in triplicate. (A) Partial least squares scores t1 vs t2. Q2Y(cum)=0.96 for the first two components. (B) First dimension PLS loadings (w1) plotted against mass variables. (C) Low mass range, mean spectrum derived from all nine spectra generated from the normal tissue samples. (D) Low mass range, mean spectrum derived from all nine spectra generated from the tumour tissue samples. The shading of the bars under the spectra in (C) and (D) indicates the sign and magnitude of the w1 values for each m/z variable: black corresponds to high positive w1 values (i.e. parts of the spectra where the tumour samples' spectra display substantially higher relative intensities than the normal samples' spectra), white corresponds to high negative w1 values (i.e. parts of the spectra where the normal samples' spectra have substantially higher relative intensities) and grey corresponds to low w1 values. The colour coding is the same in the blown-up region of the spectra (inset), but scaled according to the minimum and maximum w1 values associated with that region.

