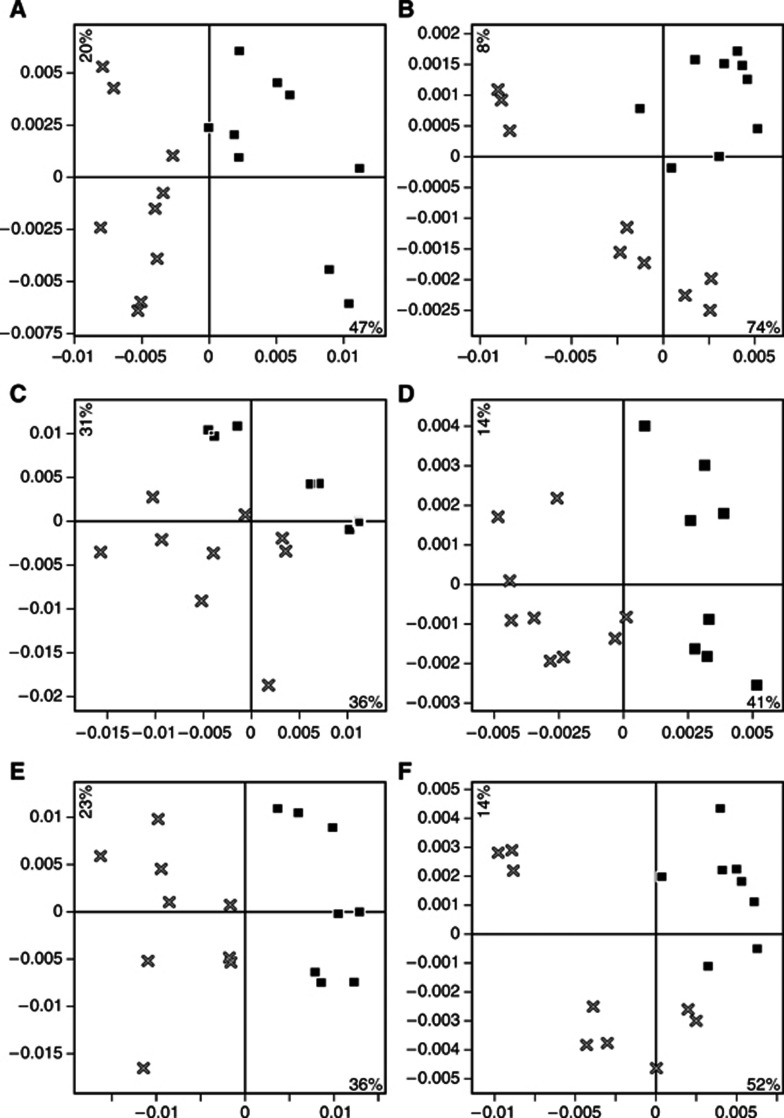
Figure 4.
Principal component analysis of data collected 12 days after treatment from different fractions and mass regions clearly distinguishes treated and untreated tumour samples. All panels represent the first two PCA scores vectors plotted against each other, t1 on the x axes and t2 on the y axes. × and ▪ represent treated and untreated samples, respectively. (A) Supernatant, low mass region (2.5–20 kDa). (B) Supernatant, high mass region (20–50 kDa). (C) Pellet, low mass region. (D) Pellet, high mass region. (E) Pellet and supernatant, low mass region. (F) Pellet and supernatant, high mass region.

