Figure 6.
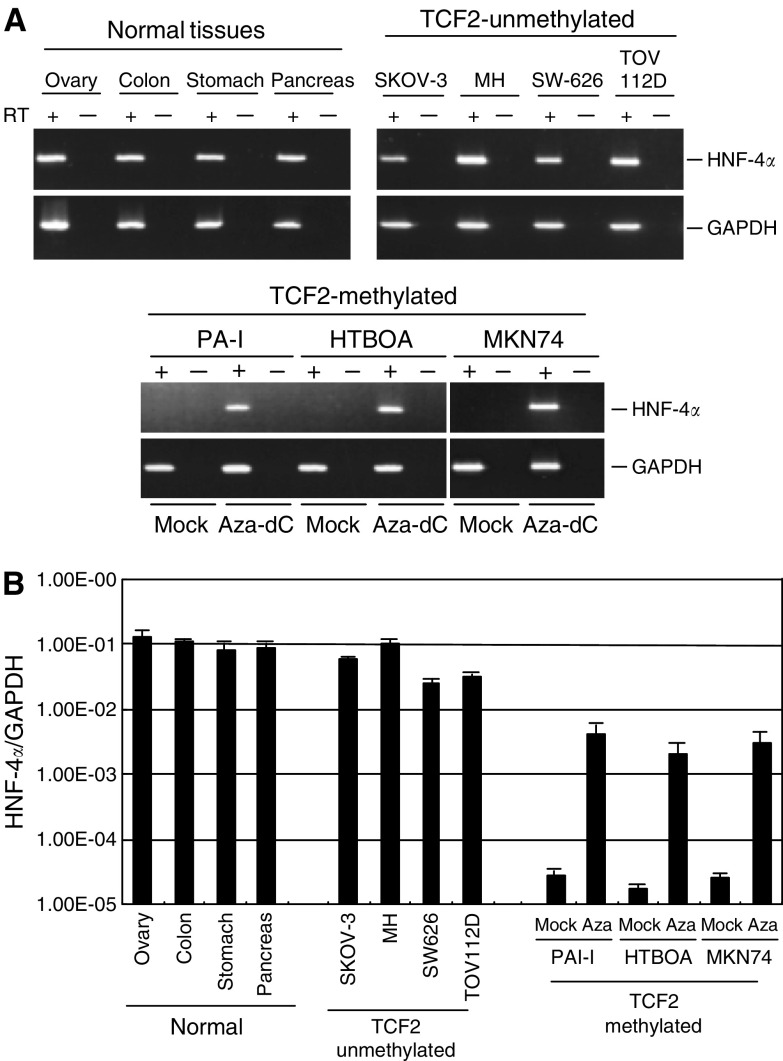
Analysis of HNF4α mRNA expression. (A) Expression of HNF-4α in cancer cell lines and normal tissues was analysed by RT–PCR. Cell lines, TCF2 methylation statuses, and tissue types are shown on the top. PAI-1, HTBOA and MKN74 cells were treated with 5-aza-dC (Aza-dC) and examined for restoration of HNF-4α. (B) Quantitative analysis of HNF-4α mRNA expression using real-time PCR. Levels of HNF-4α mRNA were normalised to those of GAPDH mRNA.

