
FIGURE 1. ERAD of ENaC α subunit in yeast requires sHsps for maximal efficiency.
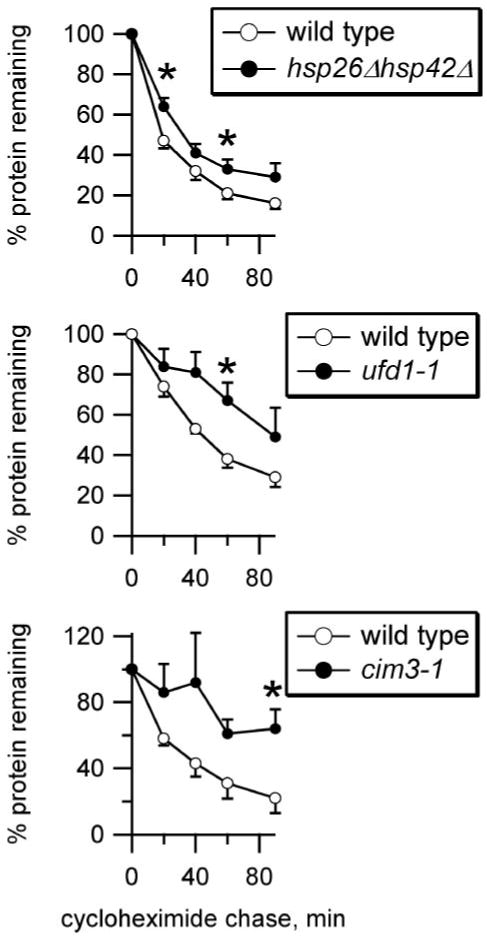
ENaC HAαV5 degradation was measured by lysing cells at various times during a chase following cycloheximide addition, and protein levels were quantified by Western analysis and normalized to Sec61 levels. ENaC α subunit degradation was measured for both wild type (○) and mutant (●) yeast, as indicated. n = 6 (hsp26Δhsp42Δ) or 4 (ufd1-1, cim3-1). *, p < 0.05 versus wild type yeast, determined by Student's t test.