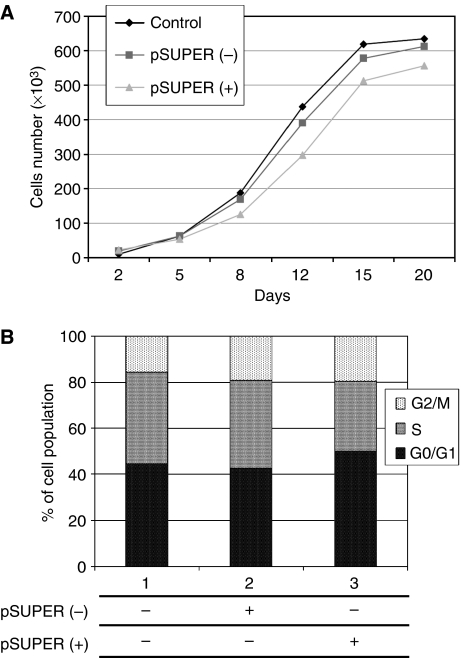
Figure 7.
Effect of pSUPER.retro infection system on the viability and the cell cycle distribution of HT29 cells. Proliferation curves were determined by the MTT assay (A) and the cell cycle distribution analysis was carried out on 1 × 10⁶ cells samples−1 after 60 min of incubation with BrdU (B). All procedures are described under Material and Methods. Control: HT29 wild-type cells (• and lane 1); pSUPER(−): HT29 cells infected with vector nonexpressing anti-COX2 shRNA (▪ and lane 2); pSUPER(+): infected HT29 cells expressing shRNA against COX-2 mRNA (▴ and lane 3). All data represent the mean of three independent experiments.

