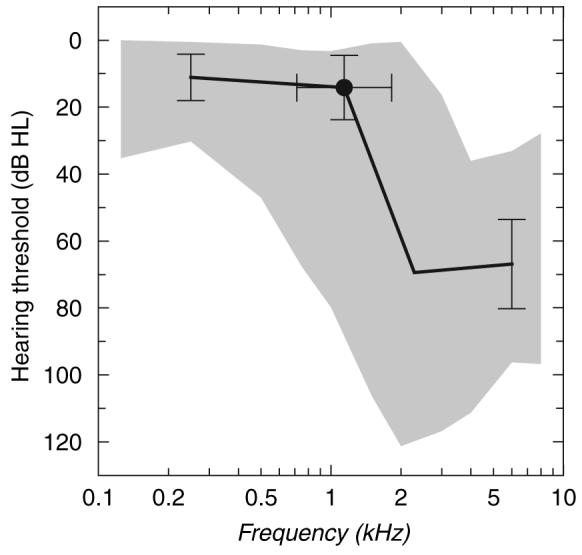
Figure 1.

Range of hearing threshold levels of the subjects and key audiometric values with standard deviation bars (±s.d.). The typical audiogram is composed by connecting with straight lines the following key audiometric points through the average values: Hearing level (HL) at 250 Hz, HL at the corner frequency, HL one octave above the corner frequency and HL at 8000 Hz.
