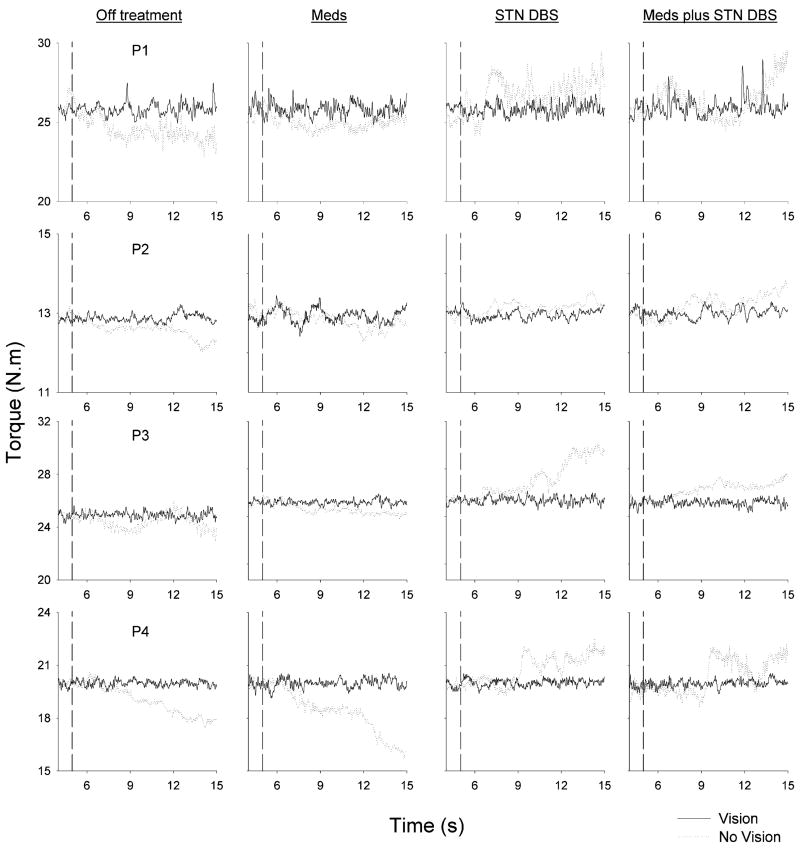
Fig. 1.
Individual force trial records from four PD patients (P1–P4) under each of four treatment conditions (Off treatment, Meds, STN DBS, and Meds plus STN DBS) under full visual feedback (solid lines) and visual feedback removed (dotted lines). The vertical dashed line in each plot represents the point at which visual feedback was removed in the visual feedback removed condition.

