
Figure 4.
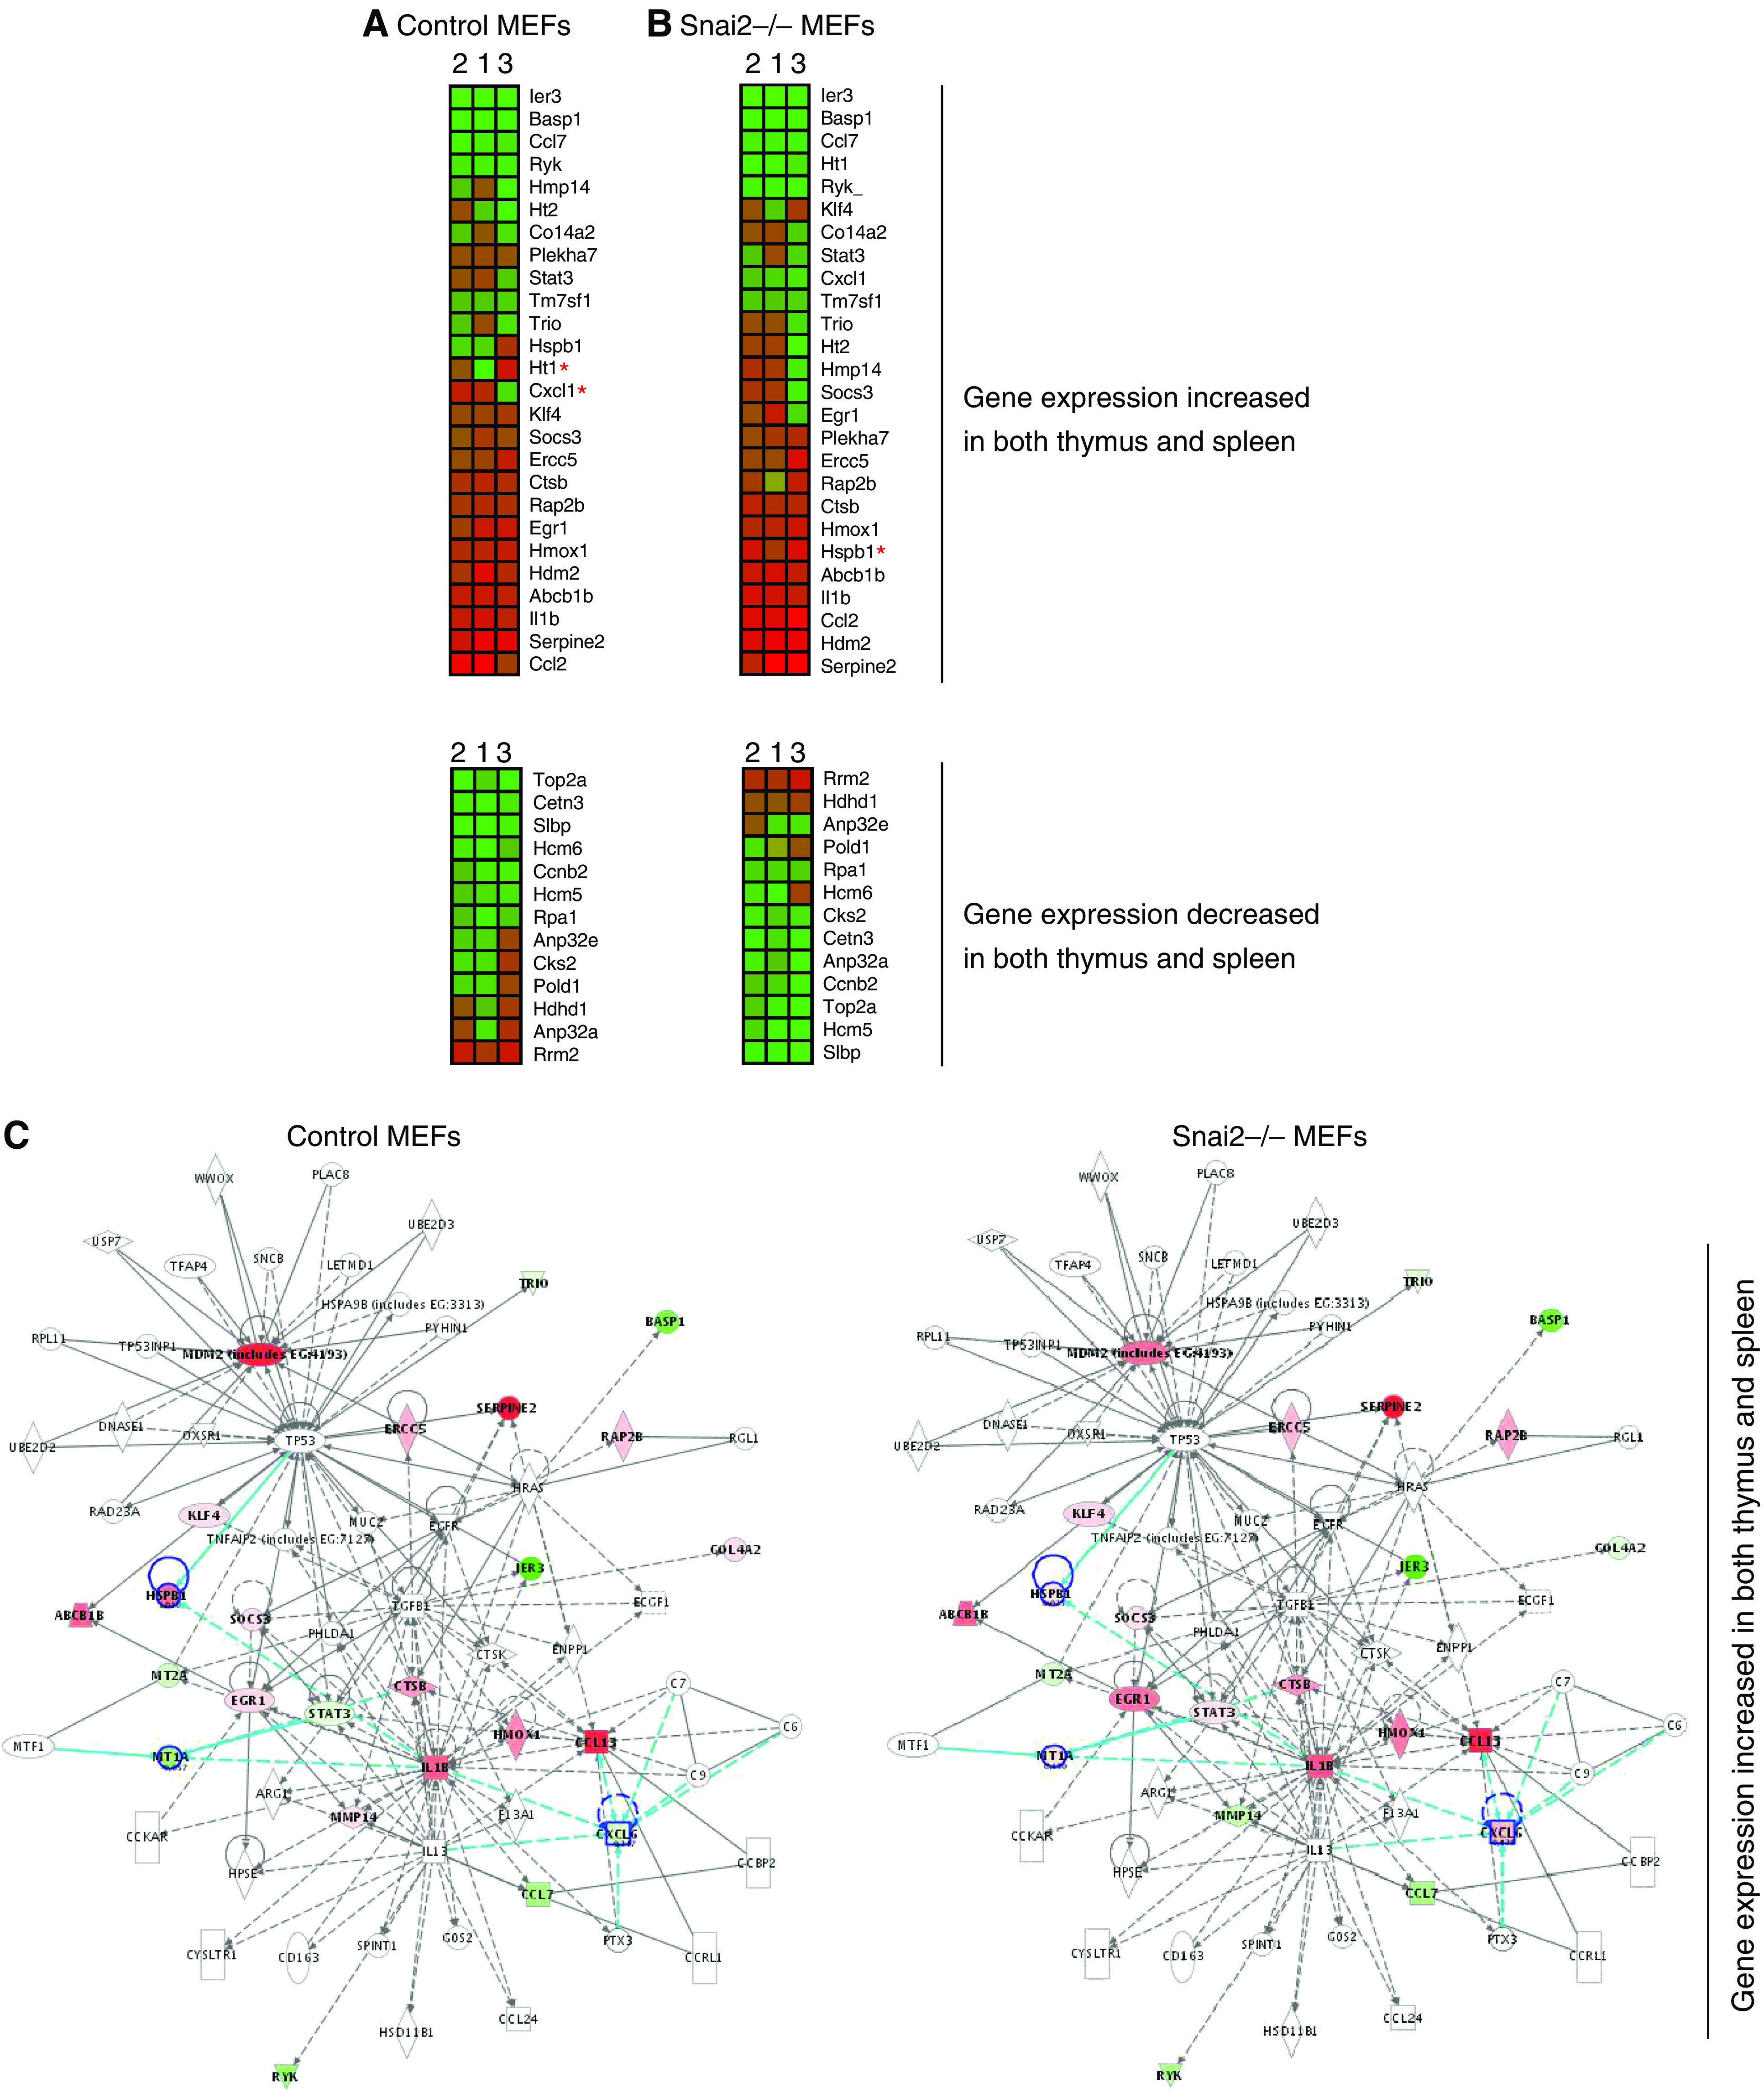
Graphical expression pattern in wild-type mouse embryonic fibroblasts (MEFs) (A) and Snai2-deficient MEFs (B) of genes upregulated and downregulated by p53 in response to DNA damage. Described genes upregulated and downregulated by p53 in the thymus and spleen (Burns and El-Deiry, 2003) in response to DNA damage were analysed. Each gene (identified at right) represented by a single row of coloured boxes; each independent experiment is represented by one single column. A red asterisk indicates major changes between control and Snai2-deficient MEFs. (C) Identification of Slug-dependent proteins using the Ingenuity database. Nodes are colour-coded in red (upregulated) or green (downregulated) according to their fold changes value.