
Figure 4.
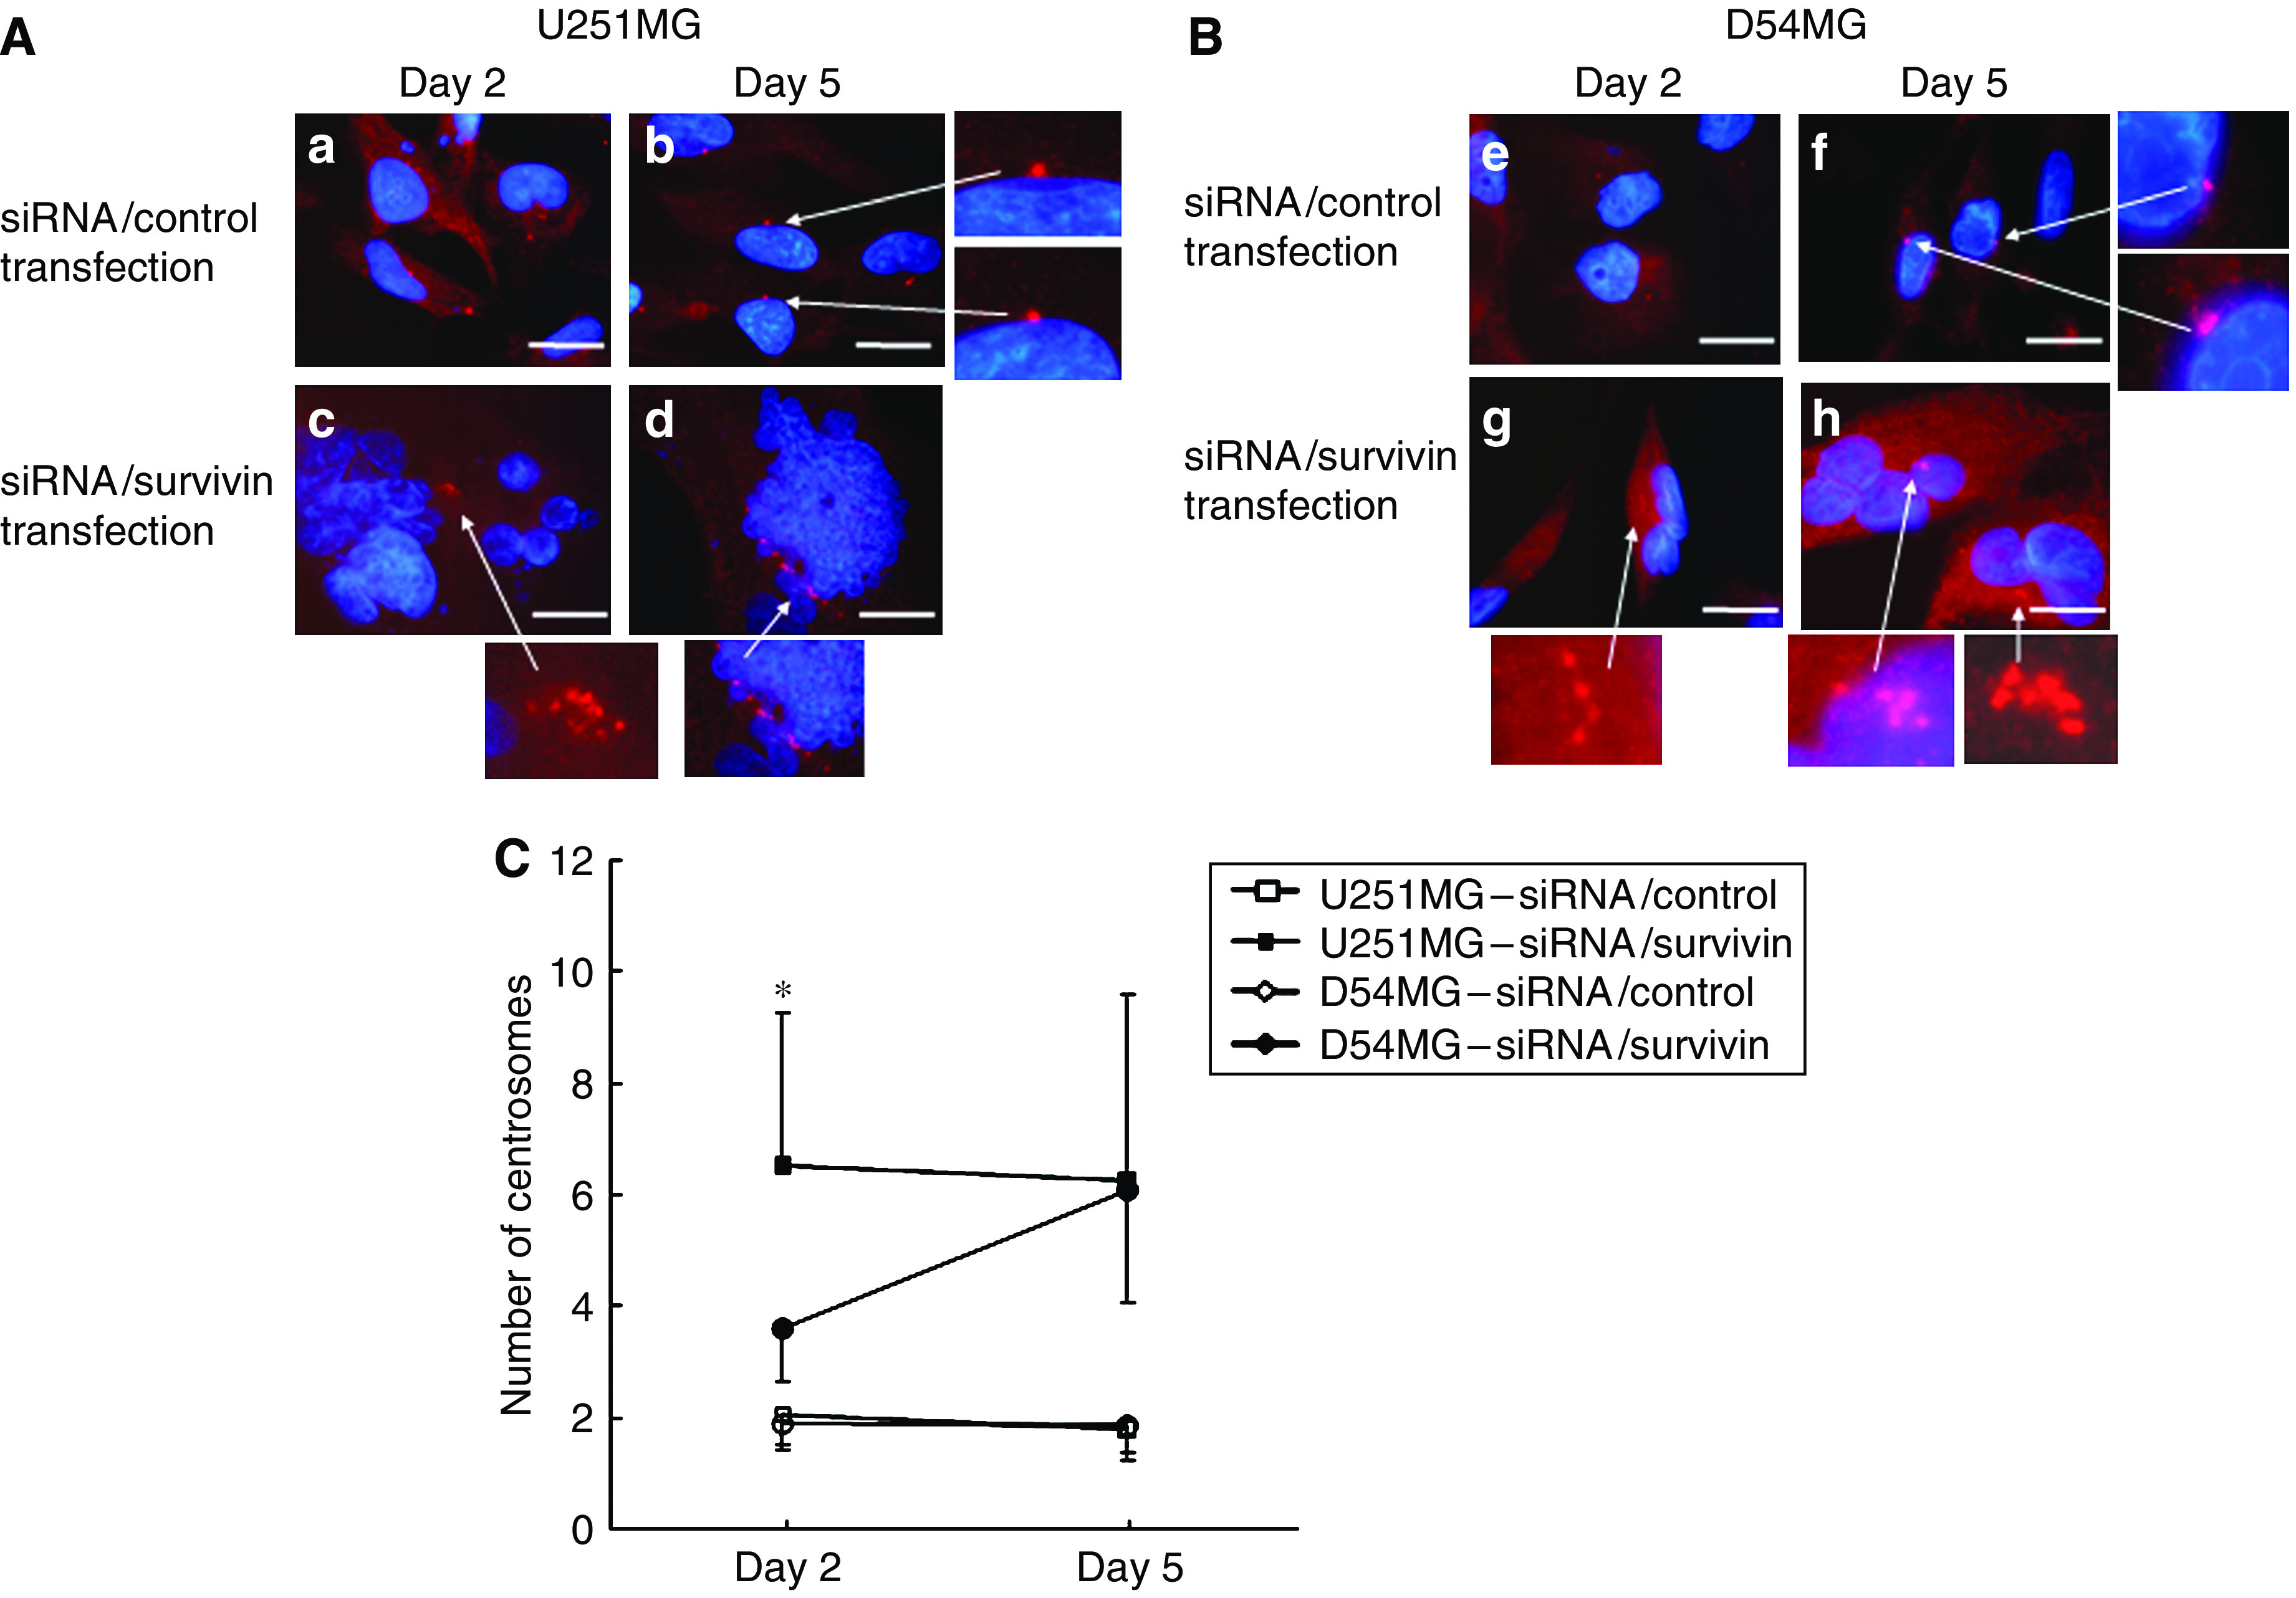
An immunofluorescent analysis of U251MG (A) and D54MG (B) cells on days 2 (48 h) and 5 (120 h) after transfection with siRNA. Cells treated with siRNA/control or survivin were immunostained for centrosomes (red dot) using anti-γ-tubulin and counterstained for DNA with 4′,6′-diamidino-2-phenylindole (blue). (A) (a, b) U251MG cells treated with siRNA/control, (c, d) U251MG cells treated with siRNA/survivin. (B) (e, f) D54MG cells treated with siRNA/control, (g, h) D54MG cells treated with siRNA/control. (C) The number of centrosomes in U251MG and D54MG cells transfected with siRNA/control or survivin on days 2 and 5. The results are presented as the mean±s.d. with a minimum of 500 cells being scored. *P<0.001 compared with siRNA/survivin-transfected D54MG cells on day 2. Scale bar, 10 μm.