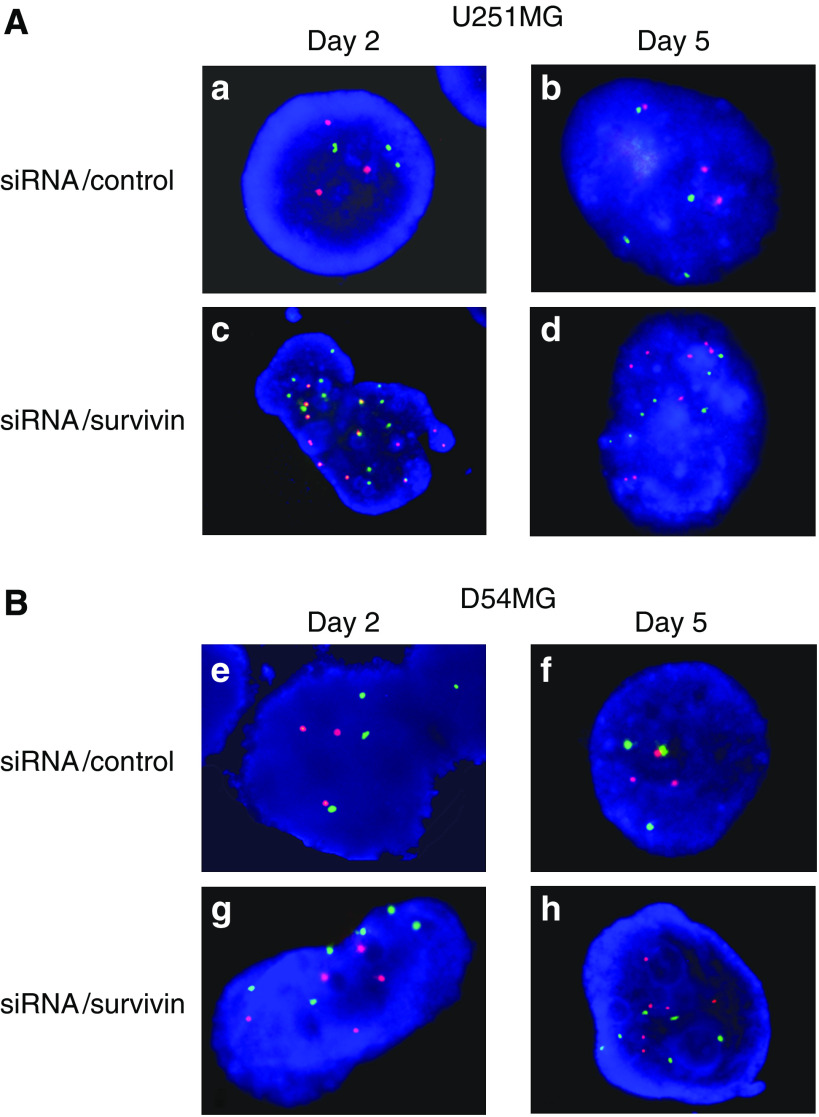
Figure 6.
A FISH analysis of U251MG (A) and D54MG (B) cells on days 2 (48 h) and 5 (120 h) after transfection with siRNA. The cells treated with siRNA/control or survivin were examined by FISH using fluorescent probes for chromosomes 2 (red) and 17 (green). (A) (a, b) U251MG cells treated with siRNA/control, (c, d) U251MG cells treated with siRNA/survivin. (B) (e, f) D54MG cells treated with siRNA/control, (g, h) D54MG cells treated with siRNA/control.

