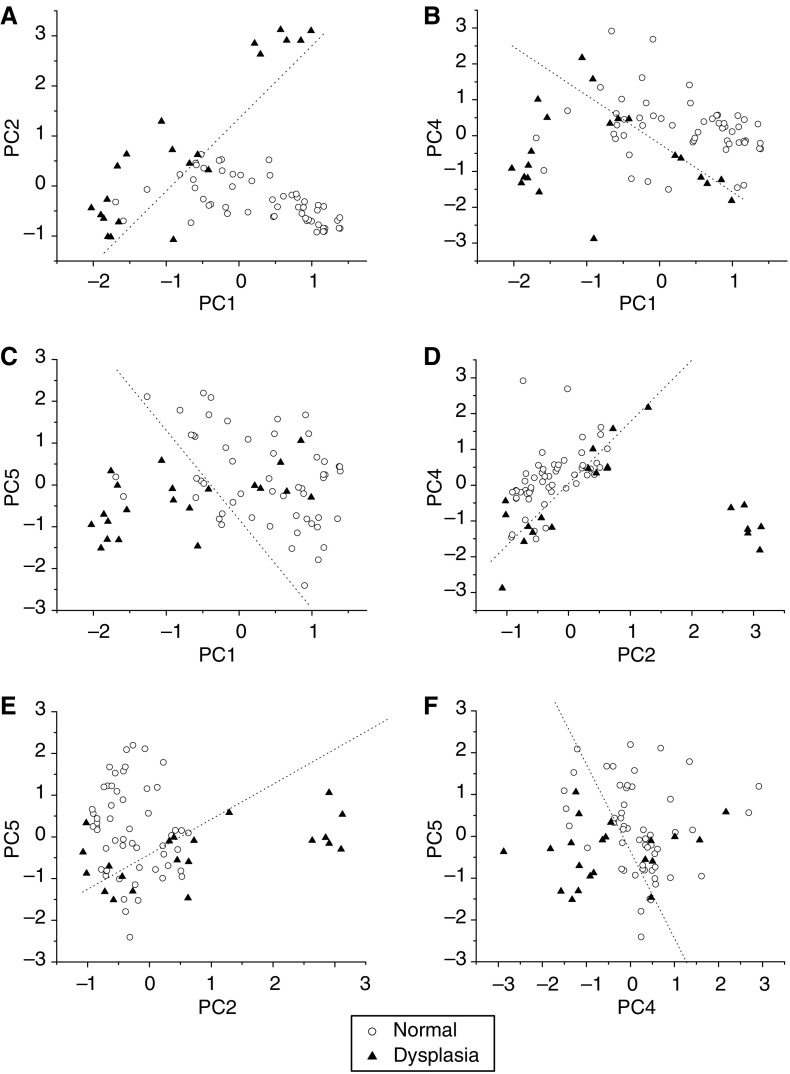
Figure 7.
Scatter plots of the diagnostically significantly principal component (PC) scores for normal and dysplastic gastric tissue derived from Raman spectra, (A) PC1 vs PC2; (B) PC1 vs PC4; (C) PC1 vs PC5; (D) PC2 vs PC4; (E) PC2 vs PC5; and (F) PC4 vs PC5. The dotted lines (PC2=1.46 PC1+1.34; PC4=−1.32 PC1+0.94; PC5=−2.16 PC1−0.89; PC4=1.74 PC2+0.12; PC5=0.84 PC2−0.381; and PC5=−2.05 PC4−0.29) as diagnostic algorithms classify dysplasia from normal with sensitivity of 90.5% (19/21), 76.2% (16/21), 71.4% (15/21), 81.0% (17/21), 71.4% (15/21), and 71.4% (15/21); specificity of 90.9% (50/55), 80.0% (44/55), 83.6% (46/55), 80.0% (44/55), 72.7% (40/55), and 72.7% (40/55), respectively. Circle (○): normal; Triangle (▴): dysplasia.

