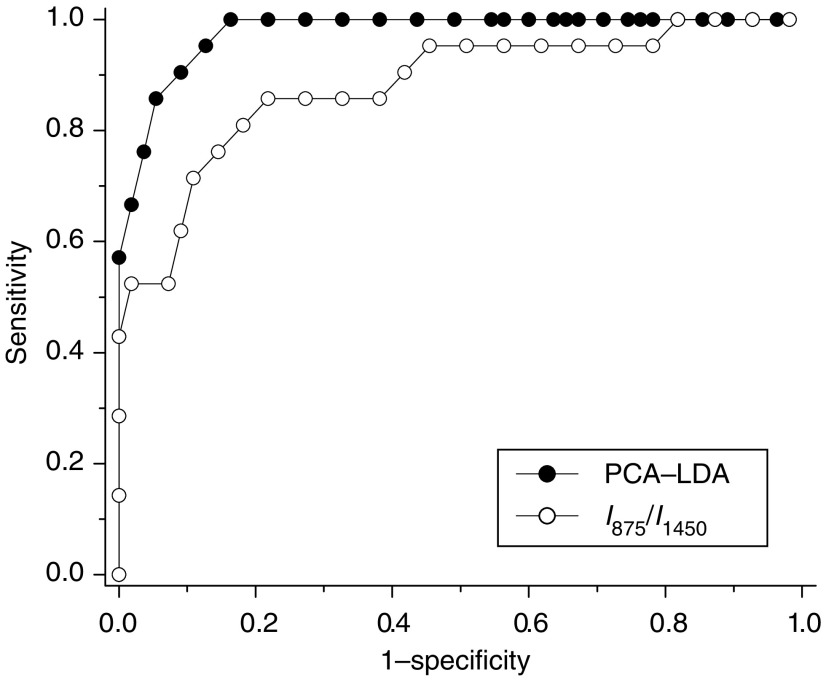
Figure 9.
Comparison of receiver operating characteristic (ROC) curves of discrimination results for Raman spectra utilising the PCA-LDA-based spectral classification with leave-one-spectrum-out, cross-validation method and the empirical approach using Raman intensity ratio of I875/I1450. The integration areas under the ROC curves are 0.98 and 0.88 for PCA-LDA-based diagnostic algorithm and intensity ratio algorithm, respectively, demonstrating the efficacy of PCA-LDA algorithms for tissue classification. LDA, linear discriminant analysis; PCA, principal components analysis.

