Figure 1.
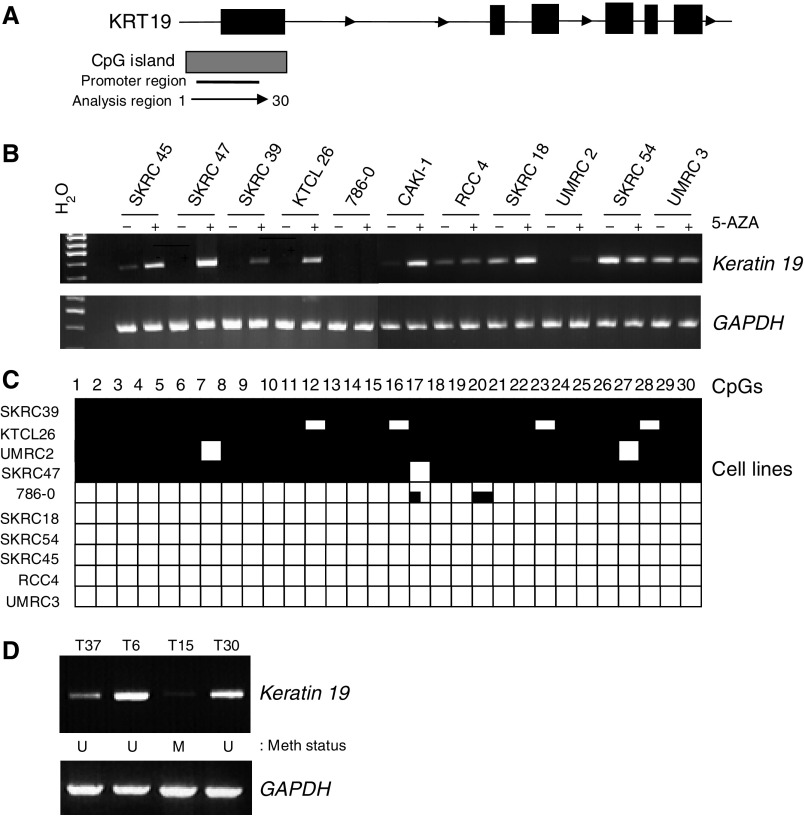
Tumour-specific KRT19 promoter methylation. (A) Schematic of CpG island and predicted promoter region in relation to the KRT19 gene. (B) RT–PCR analysis of KTN19 shows silencing in five RCC cell lines. Expression is reactivated in four lines following treatment with 5-AZA. (C) Promoter region methylation analysis by direct sequencing indicates that methylation correlates with gene silencing. (D) Methylation correlated to expression in tumours; compare the methylation status of samples 15T and 30T with expression by RT–PCR. T, tumour, M, mehtylated promoter, U, unmethylated promoter.

