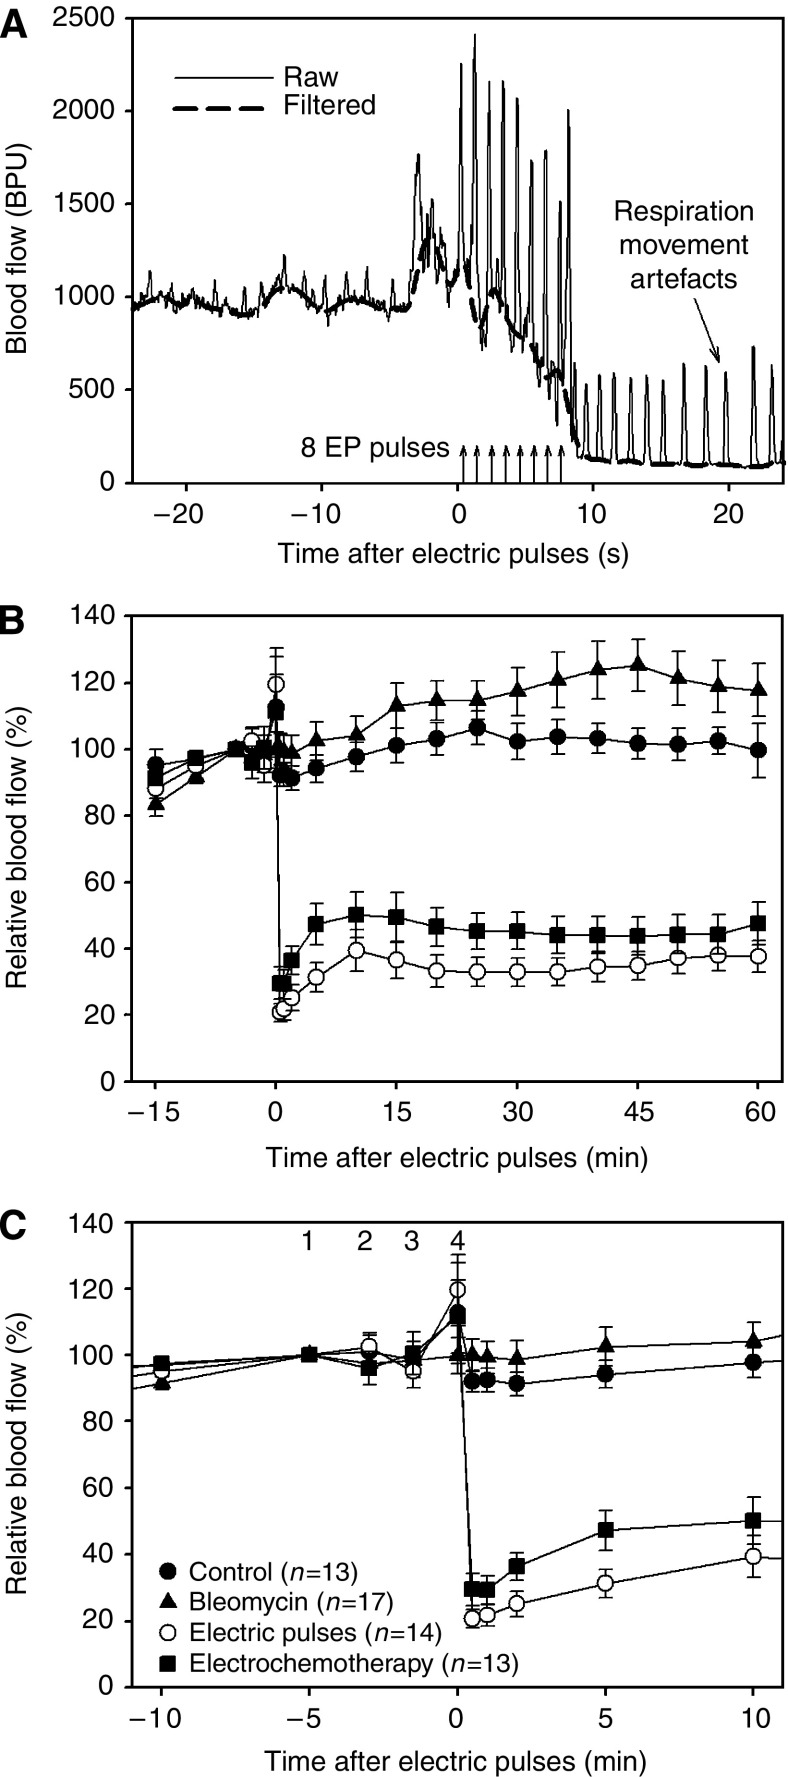
Figure 5.
Blood flow changes after different treatments assessed by means of laser Doppler flowmetry. (A) Rapid decrease in blood flow immediately after application of electric pulses (EP). Movement artefact caused by the pulses, manipulation of the electrodes (spikes just before and after pulses) and respiration (before and after electroporation) can be observed in the raw signal along with the filtered signal. (B) Average blood flow values before and after treatment expressed as a percentage of the pretreatment blood flow (mean values with s.e. bars are shown). After time zero, the differences between the groups were statistically highly significant (P<0.001). (C) A close-up from (B): (1) pretreatment level at −5 min; (2) moment of injection at −3 min; (3) −1.5 min; (4) time zero. Relatively large scatter (nonsignificant) of values at time zero was of transient nature and was a result of movement artefacts caused by manipulation of the electrodes. Note different time scale.

