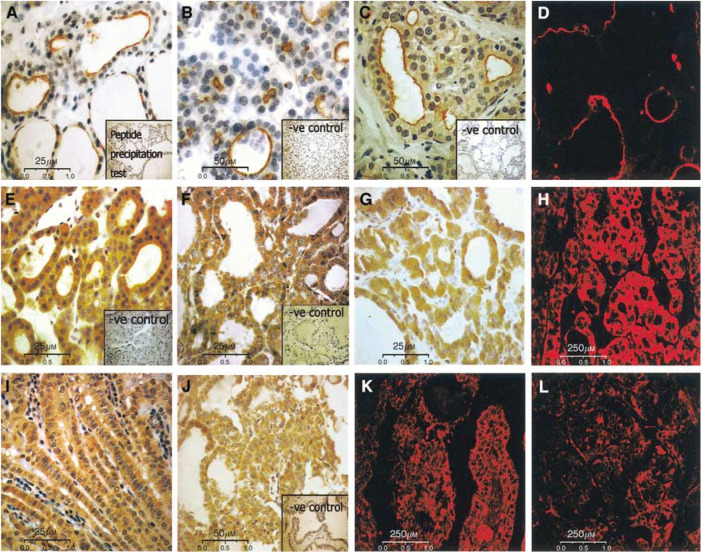
Figure 3.
Immunohistochemical analysis of expression and cellular distribution of pendrin in normal and pathological thyroid tissues. (A) Normal thyroid tissue; the apical staining is heterogeneous inside and between follicles (original magnification × 400; inset – peptide competition test control); (B) immunostaining for pendrin in NG. The staining is restricted to the small proliferating follicles (original magnification × 200; inset – peptide competition test control); (C) Graves' tissue with distinct apical staining pattern, especially observed in small follicles (original magnification × 200; inset – peptide competition test control); (D) immunostaining of pendrin in Graves' tissue by confocal microscopy, FITC-labelled anti-rabbit secondary antibody were used. (E) Follicular adenoma; immunostaining shift to the cytoplasm is observed (original magnification × 400; inset – peptide competition test control); (F) Follicular carcinoma; strong intracellular staining (original magnification × 400); (G) Follicular carcinoma; moderate intracytoplasmic stain (original magnification × 400); (H) immunofluorescence of FTC with strong intracytoplasmic pendrin expression (original magnification × 40); (I) Papillary carcinoma; strong intracellular staining (original magnification × 400; inset – peptide precipitation test control); (J) Papillary thyroid carcinoma; moderate cytoplasmic staining (original magnification × 200); (K) immunofluorescence of PTC with strong pendrin expression (original magnification × 40); (L) immunofluorescence of PTC with moderate pendrin expression (original magnification × 40).

