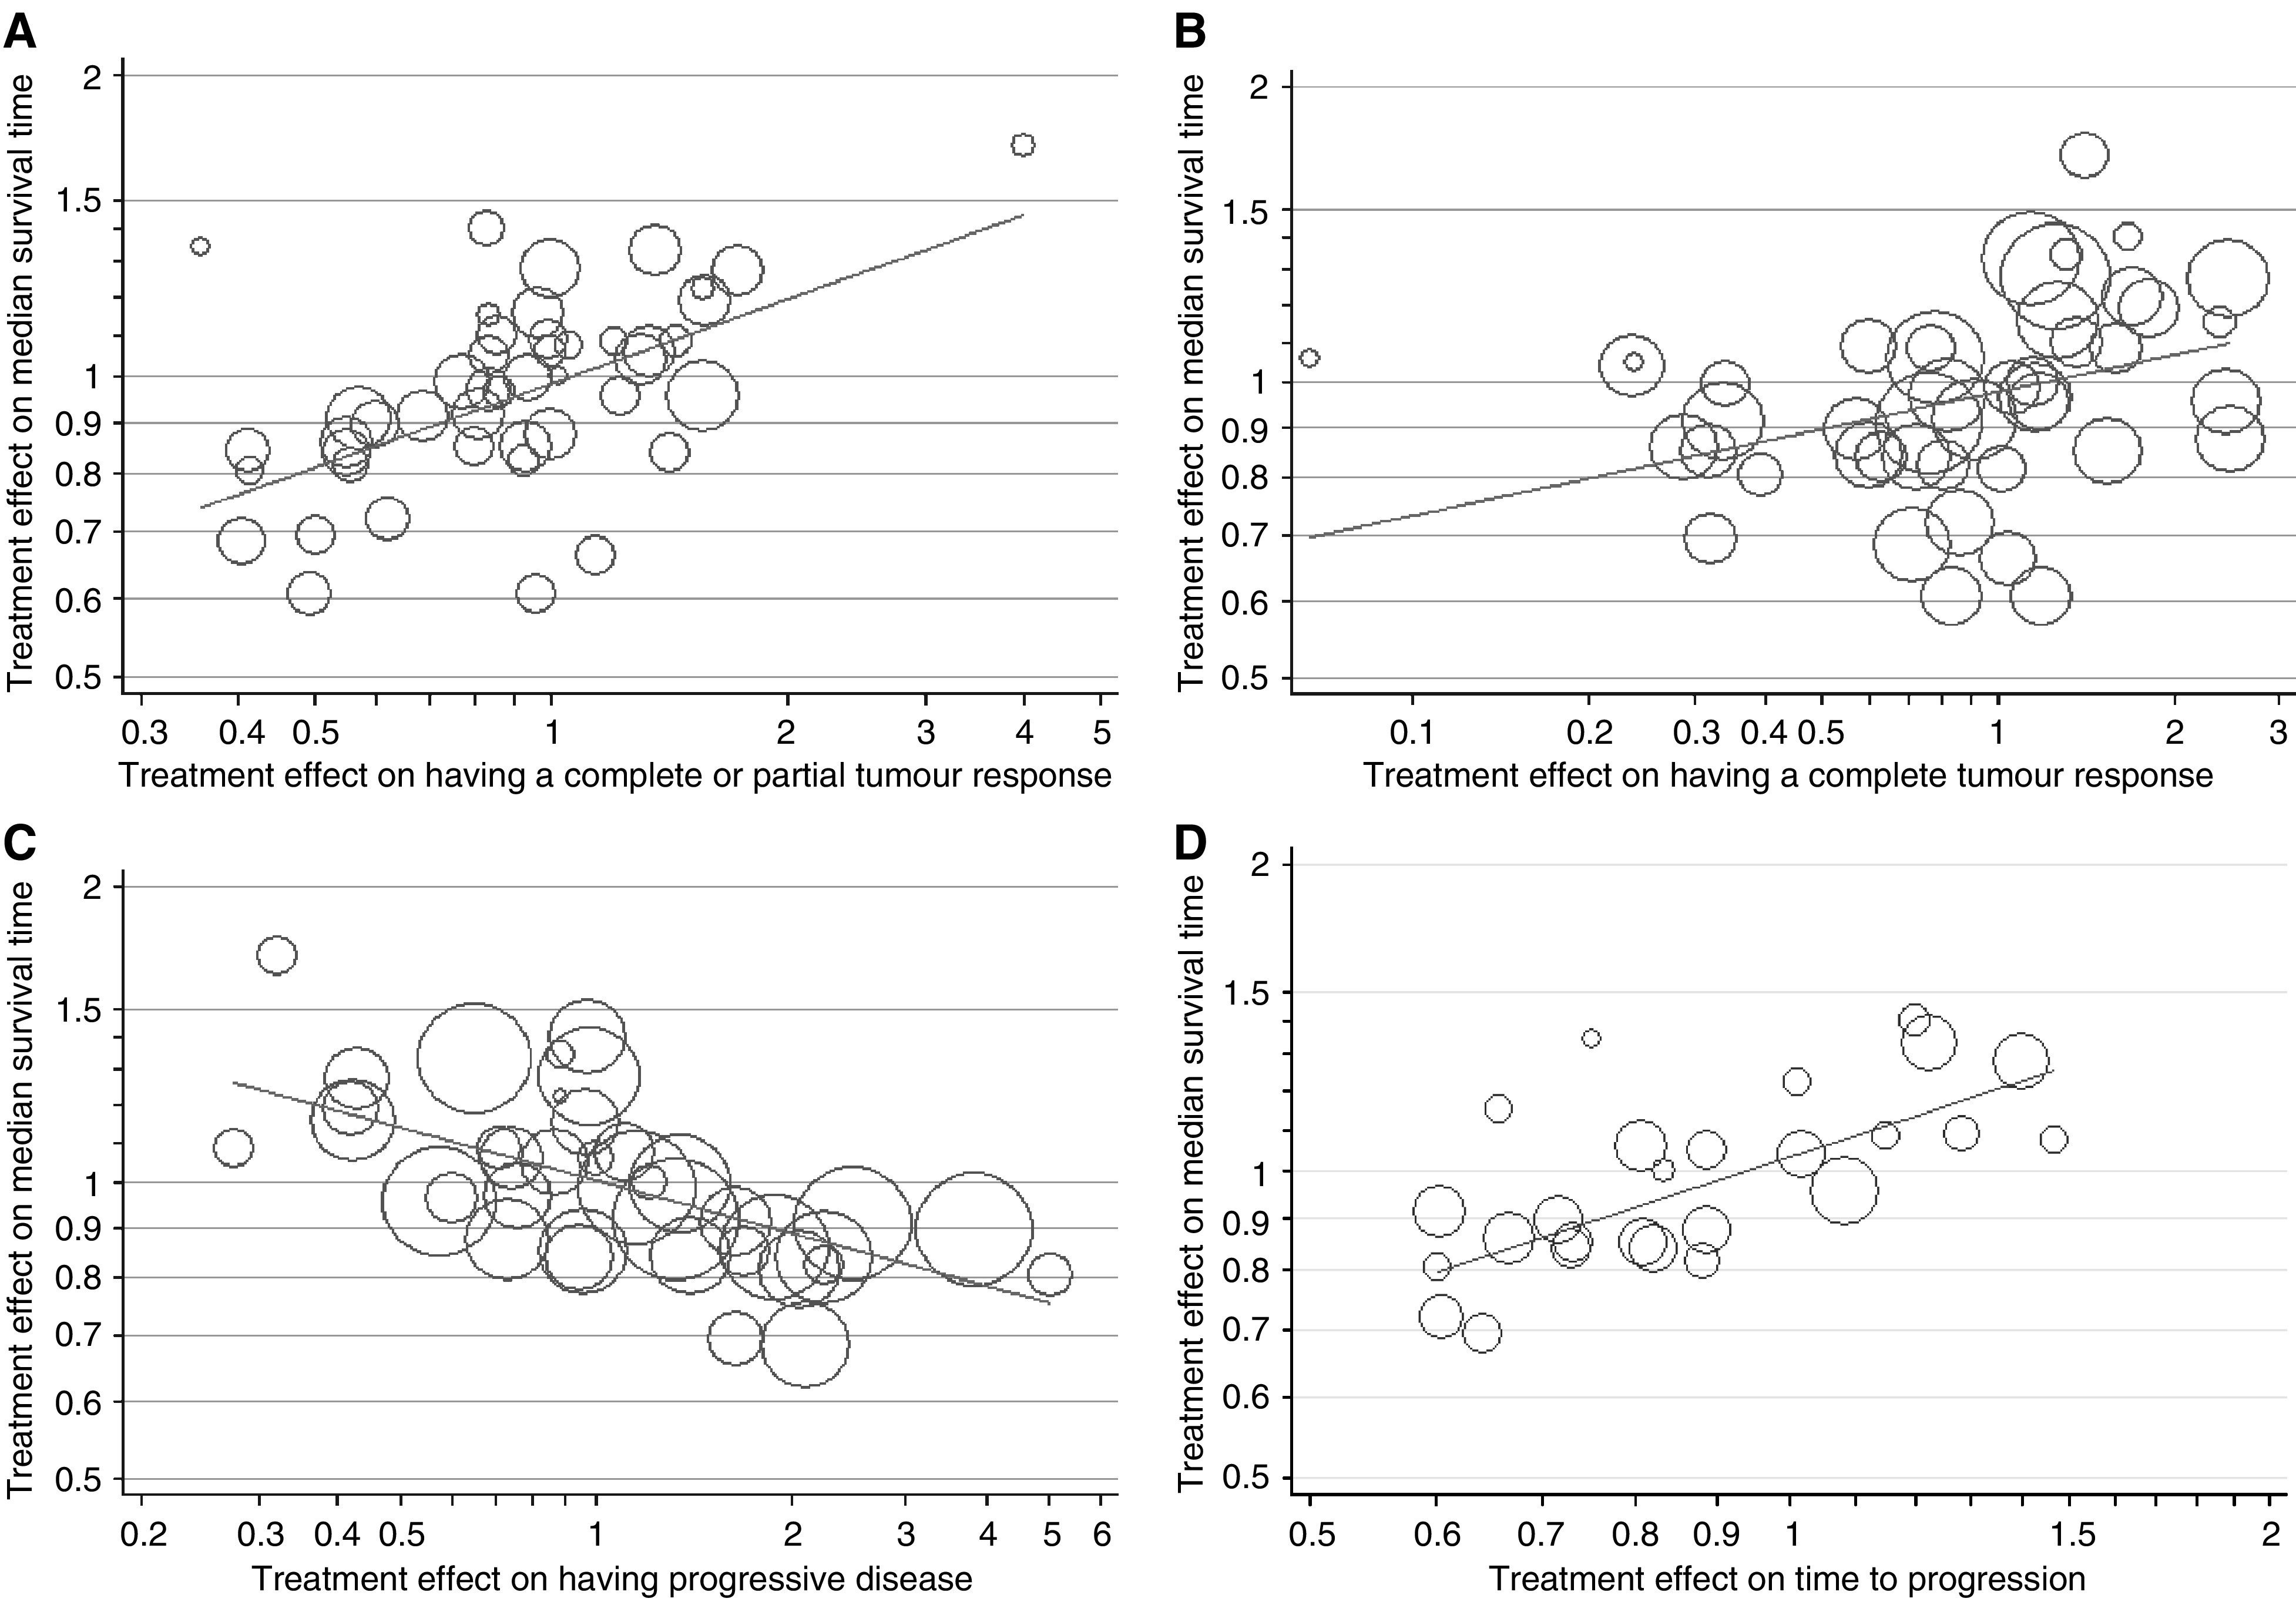
Figure 1.

The relationship between the treatment effect on median survival time and each of the four surrogate markers. The regression lines are as follows, with the corresponding P-value, coefficient of determination (R2) and standard error of the regression coefficient (s.e.) in brackets: (A) Log10 hazard ratio=−0.0081+0.2796 × log10 odds ratio for complete/partial response (P<0.0001, R2=34%, s.e.=0.0590), (B) Log10 hazard ratio=−0.0097+0.1266 × log10 odds ratio for complete response (P=0.02, R2=12%, s.e.=0.0521), (C) Log10 hazard ratio=0.0015–0.1781 × log10 odds ratio for progressive disease (P<0.0001, R2=38%, s.e.=0.0380), (D) Log10 hazard ratio=0.0135+0.5082 × log10 ratio of median time to progression (P<0.001, R2=56%, s.e.=0.0928). The size of the symbols is proportional to the inverse of the variance (the weight). For time to progression the size is proportional to the number of patients in the trial.
