
Figure 4.
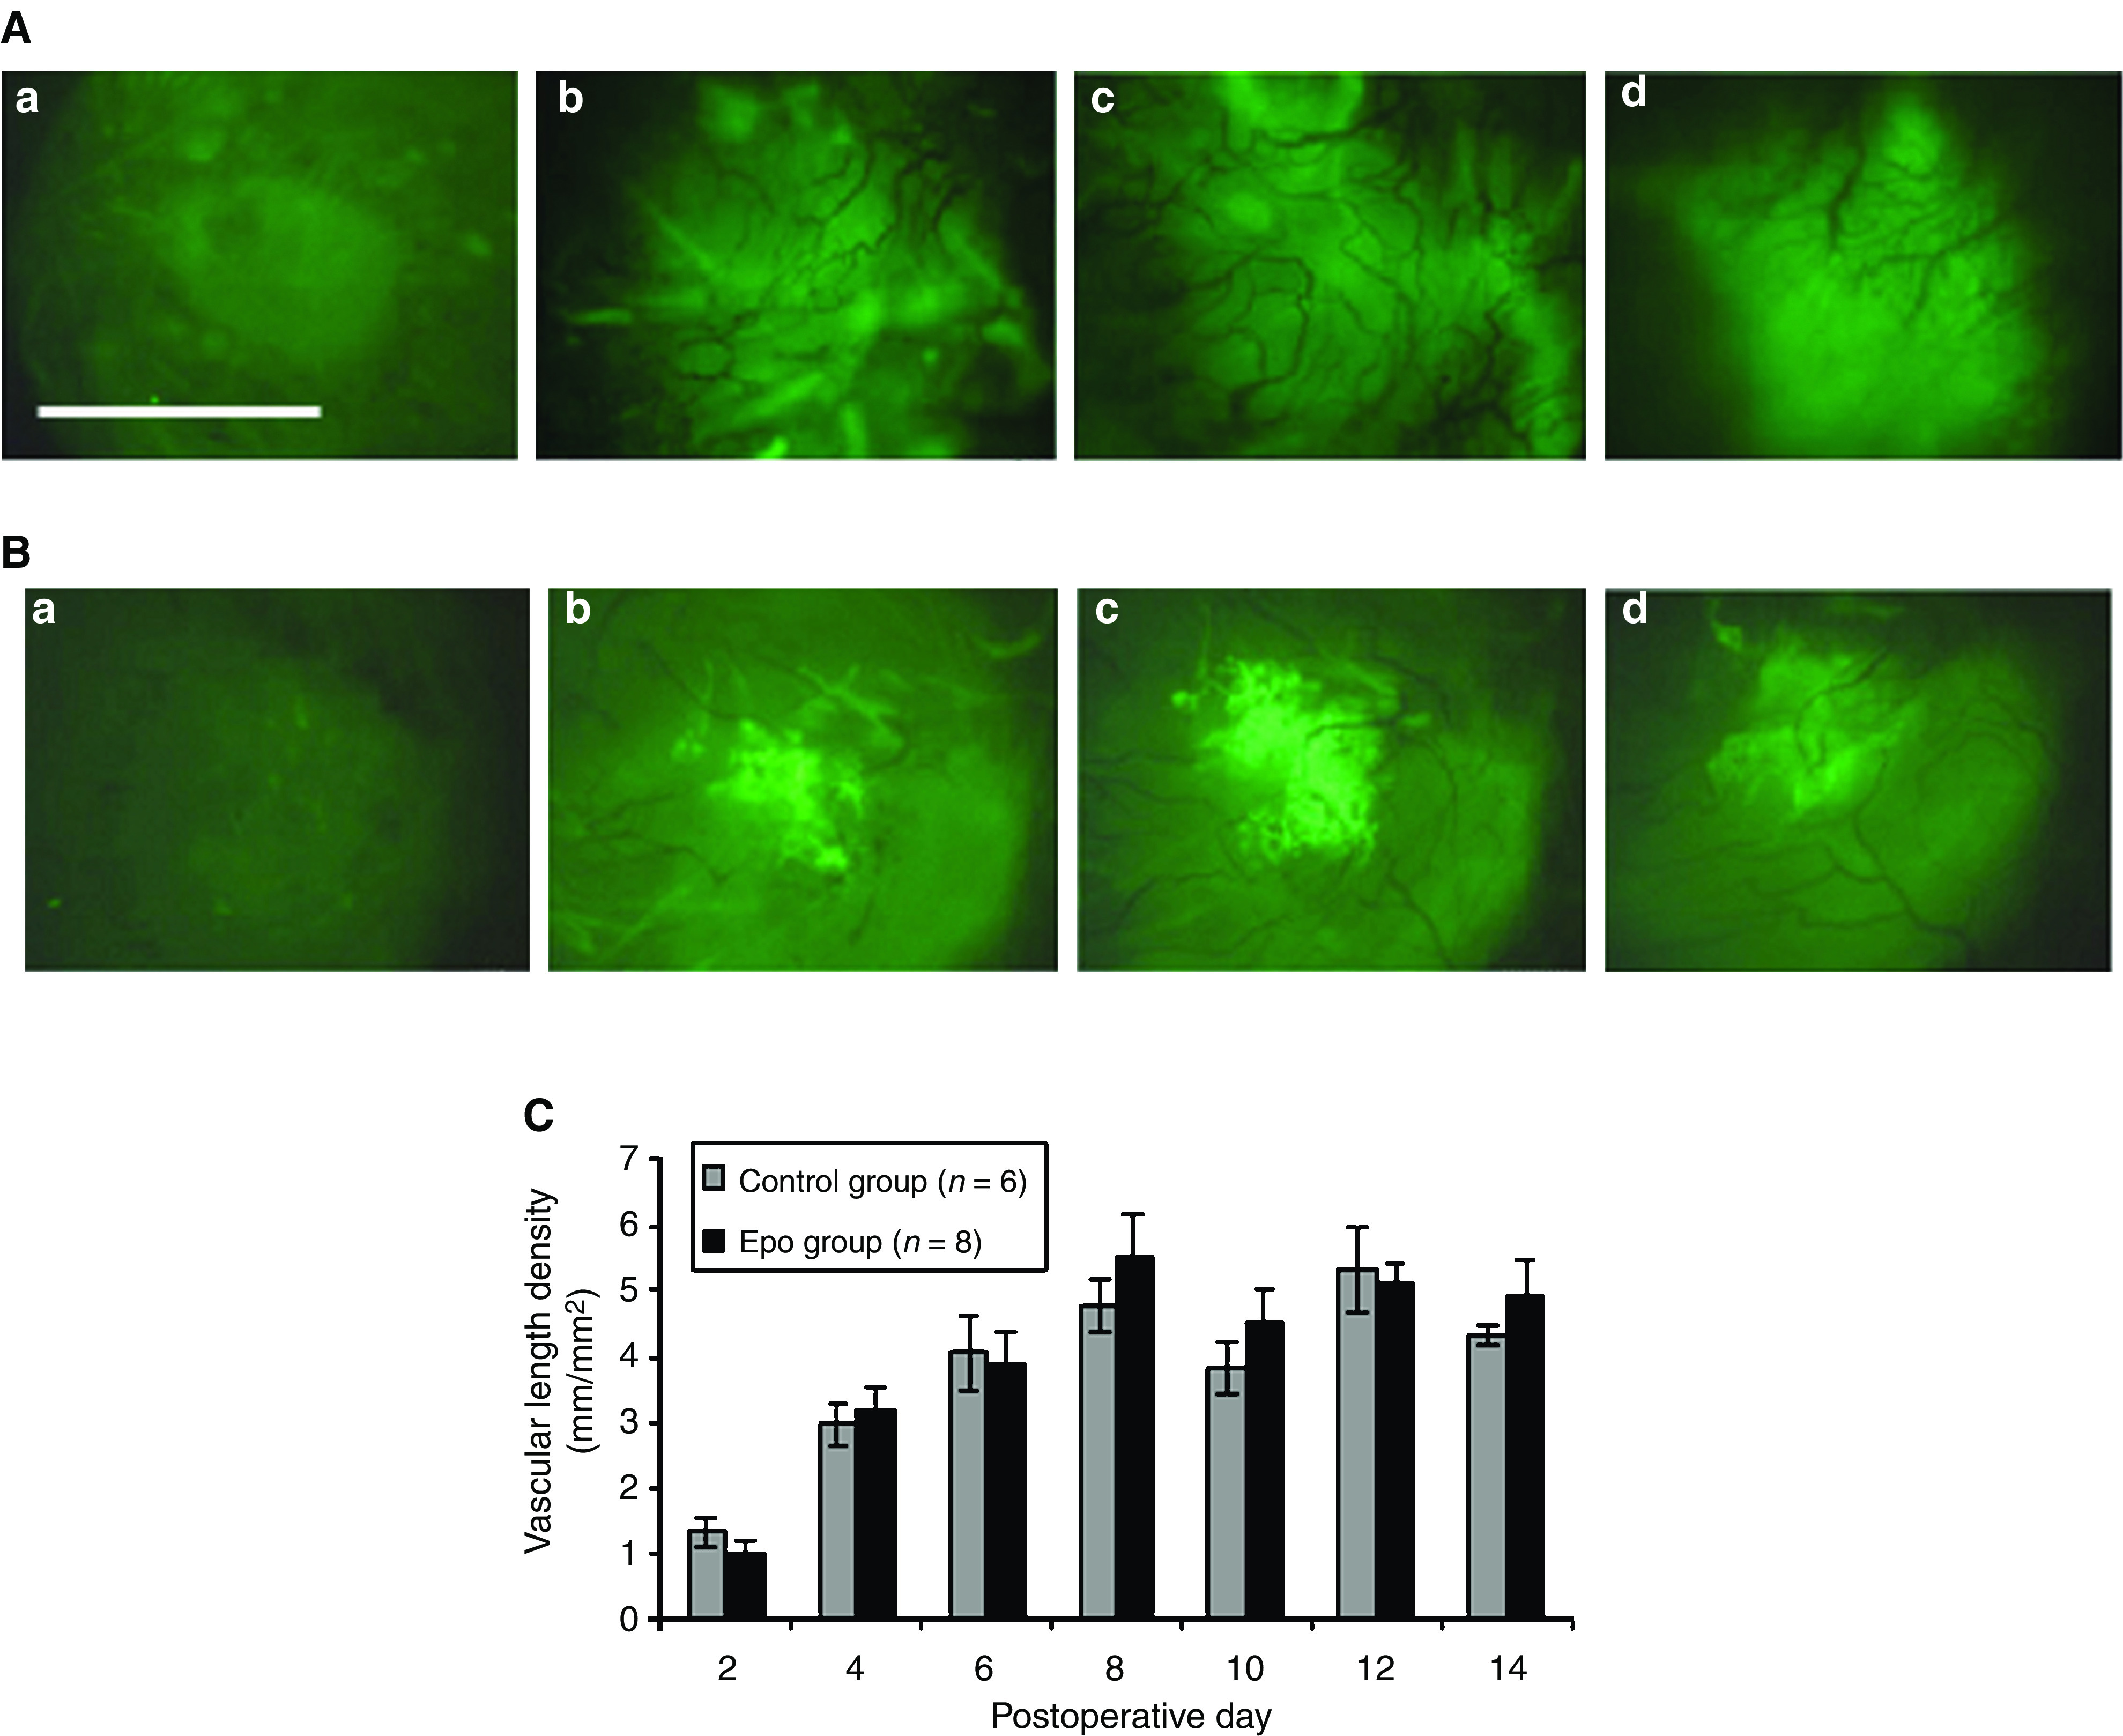
Intravital microscopy of mammary window chamber. Shown are a series of representative images from a rat in the control group (A) and the rEpo-treated group (B) and the effects of rEpo on tumour vascularity (C). Shown images from the mammary window chamber were taken at postoperative day 2 (a), 6 (b), 8 (c), and 14 (d). On postoperative day 2, the tumour size is relatively small, and little angiogenesis has occurred. By postoperative day 6, the tumour has increased in size and amassed a considerable vasculature, which continues to increase until around postoperative day 12–14, when the tumour and associated vasculature begin to reach a plateau. Vascular length density (VLD) was calculated for each animal at each time point. At all time points, there was no statistical difference (P>0.05) in the VLD of the treatment and control groups. Values represent the mean of each treatment group±standard error of the mean (s.e.m.) at each time point. Scale bar=300 m.