Figure 5.
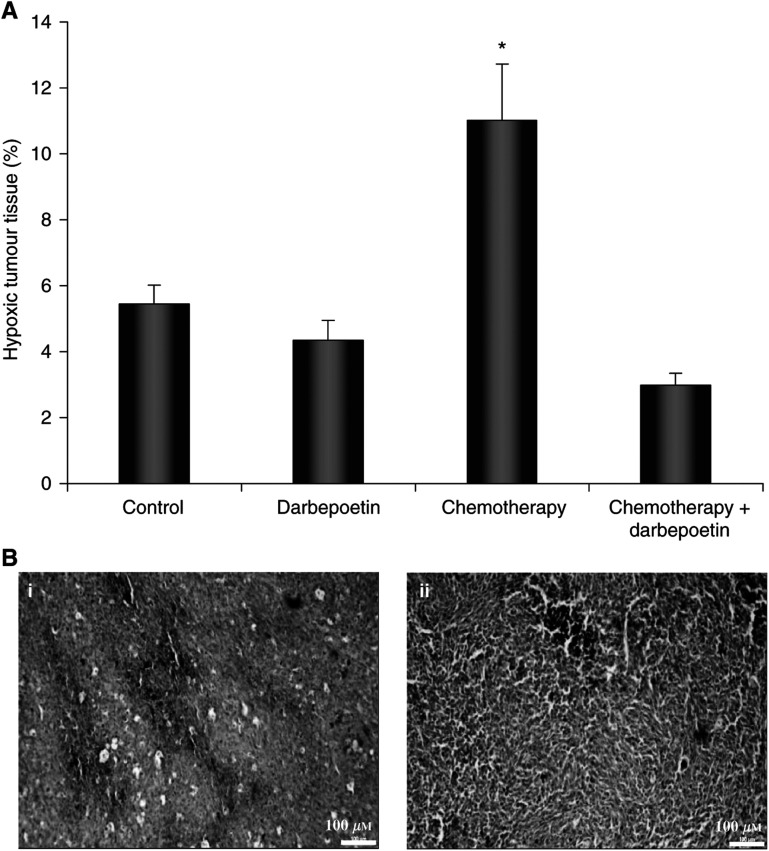
(A) Hypoxic tumour tissue, quantified by calculating Hypoxyprobe™-1 staining as a percentage of total tumour area. The data represent the mean percentage positive staining in the treatment groups (±s.e.m.). *P<0.05 vs other groups. (B) Representative micrographs (× 100 magnification) are shown of Hypoxyprobe™-1 binding (brown staining) in (i) a chemotherapy-treated tumour and (ii) tumour treated with combination chemotherapy and darbepoetin.

