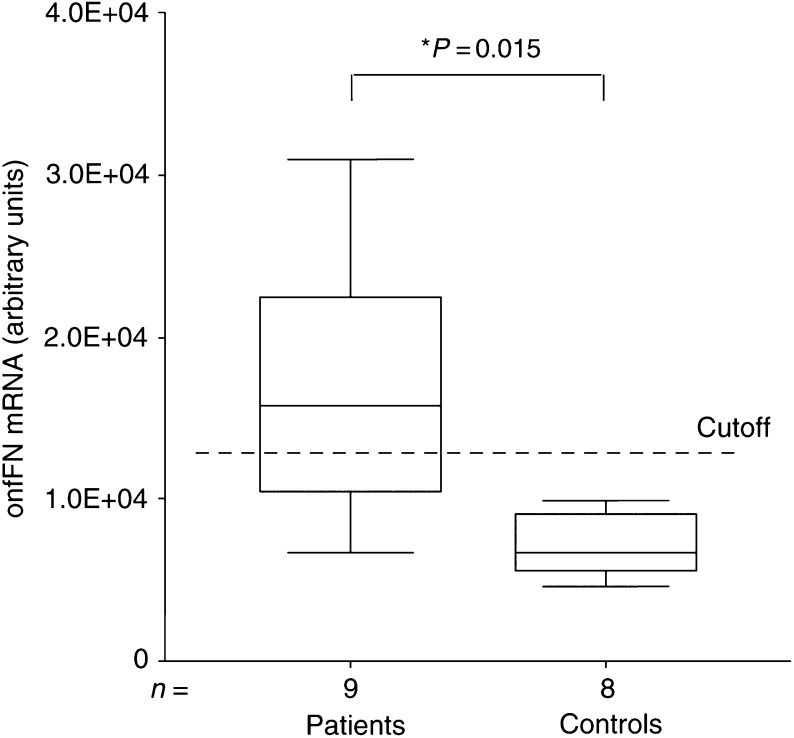
Figure 5.
Quantitative real-time PCR data are shown in a box plot graph. Based on an unspecific background signal obtained in healthy controls (n=8), we calculated a cutoff value (3 × s.d.+mean). onfFN transcripts were detected in the peripheral blood in 67% of patients (n=9) suffering from DTC metastatic disease. Expression rates of both groups are presented in arbitrary units based on copy numbers of a recombinant onfFN standard, leading to a better inter-assay precision in daily routine diagnostic.

