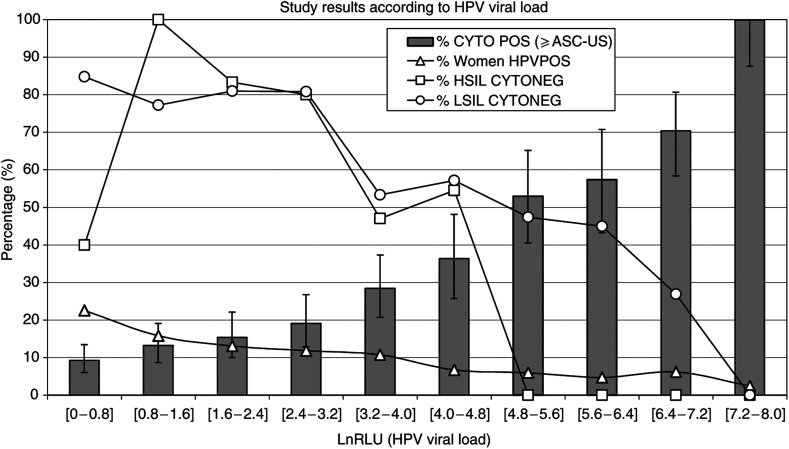
Figure 2.
Percentage (y-axis) against HPV viral load of 1143 HPV+ samples (x-axis) reported as Logarithm value of Relative Light Unit (LnRLU). The ‘% women HPVPOS’ curve shows the distribution of the HPV+ samples among LnRLU intervals. In this study, most HPV+ samples have low LnRLU: near 50% of HPV+ samples are found in the first three LnRLU intervals. The grey bars represent the percentage per LnRLU interval of positive cytological preparation (⩾ASC-US); it shows a direct relationship between the HPV viral load and the probability for a Pap test to be positive. The HSIL CYTONEG and LSIL CYTONEG curves represent the percentage per LnRLU interval of false negative cytological preparations with subsequent biopsy proven lesion.

