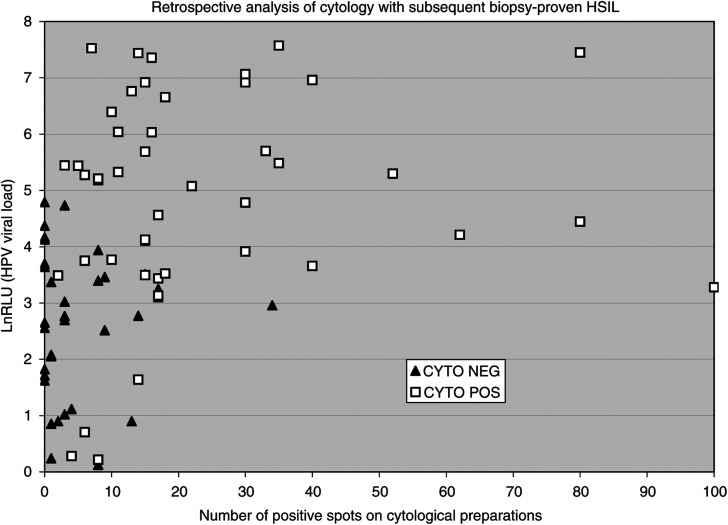
Figure 3.
Retrospective analysis of all cytological preparations associated with subsequent histological HSIL. Logarithm values of RLU (y-axis) against number of positive cellular spots (x-axis) retrospectively counted on cytological preparations. False negative CYTO (black triangles) have a smaller viral load and fewer number of positive cellular spots than true positive CYTO (white squares). Both differences are statistically significant. However, a significant number of false negative cytological preparations (11 out of 34 (32%)) have no cellular spots despite a significant viral load (n=79).

