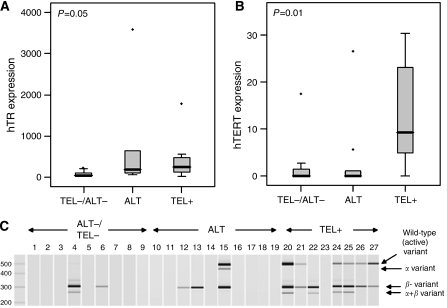
Figure 1.
Telomerase gene expression in liposarcoma samples. (A) hTR expression taken as a percentage of the riboprotein S15; (B) total hTERT expression in ng per μl. The grey box defines 25 and 75% quartiles, while error bars represent the first and 99th percentiles of the distribution. Dots represent outliers and the black line defines the median of the distribution. P-values were calculated using the Kruskal–Wallis test, which tests the likelihood of all medians being the same. (C) Four major hTERT splice variant PCR products were quantified using the Agilent Bioanalyser.

